ITS#
General considerations#
If any of the plots listed on this page remains empty during a run, please call the ITS on-call. The only exception, i.e., where empty means good quality, is for the four plots on the lane status.
Quality summary#
This figure shows the time trend of aggregated ITS quality across all ITS QC plots, along with a separate quality trend for the "Fraction of QC Cycles with data" plot:
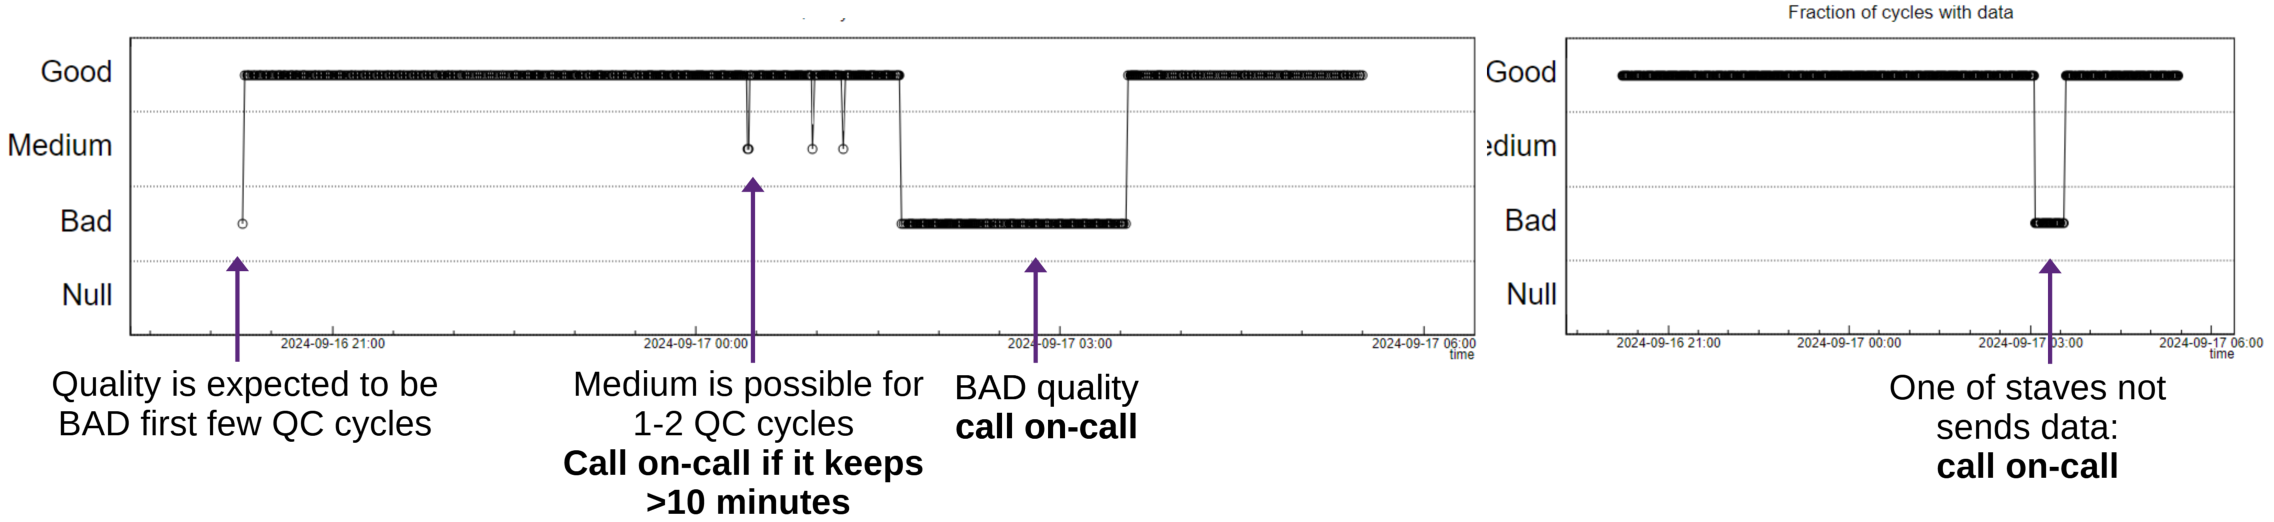
Please create a logbook entry and contact the ITS on-call if: - Any of these plots turns BAD, even if the quality flag later returns to GOOD. - Any of these plots remains Medium for longer than 10 minutes.
Additionally, the layout includes a text summary of all ITS QC checks for the latest QC cycle, as shown in the text box:
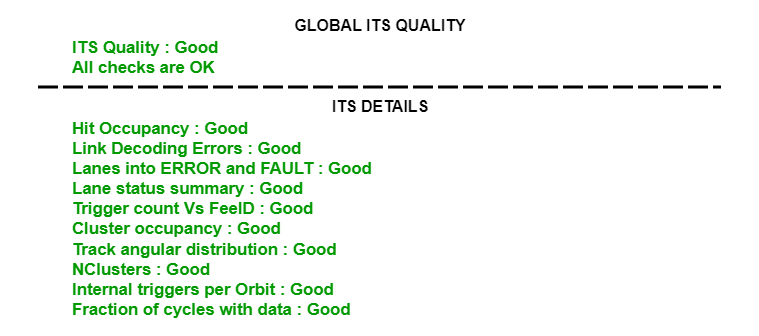
The top line provides the aggregated quality status along with a text message suggesting actions for the QC shifter.
- Quality: BAD: contact ITS on-call expert
- Quality: Medium: Contact the ITS on-call expert if the quality remains in this state for longer than 10 minutes.
- Quality: NULL: The plots are empty. Check in DCS if ITS is in STANDBY. If not, inform the ITS on-call expert.
In cases of BAD or Medium quality, this canvas will display the error message from the QC plot that triggered the issue, in the format "Flag: Unknown: ERROR MESSAGE."
Error count vs Error id#
This plot provides information about issues that occurred during the decoding of ITS data. The QC distinguishes 24 possible problems with the data, filling the Error ID into the Y-bin and the FEE ID (from where the problematic data originated) into the X-bin. A few important considerations for this plot:
- Errors with IDs 19 and 24 (last bin) are for expert purposes and do not indicate problems with the data. Therefore, they never trigger a bad quality flag in QC checks.
- In the case of corrupted data from ITS, new bins will be filled. Please note that BAD data quality is flagged by QC checks only when ITS encounters decoding issues during the most recent QC
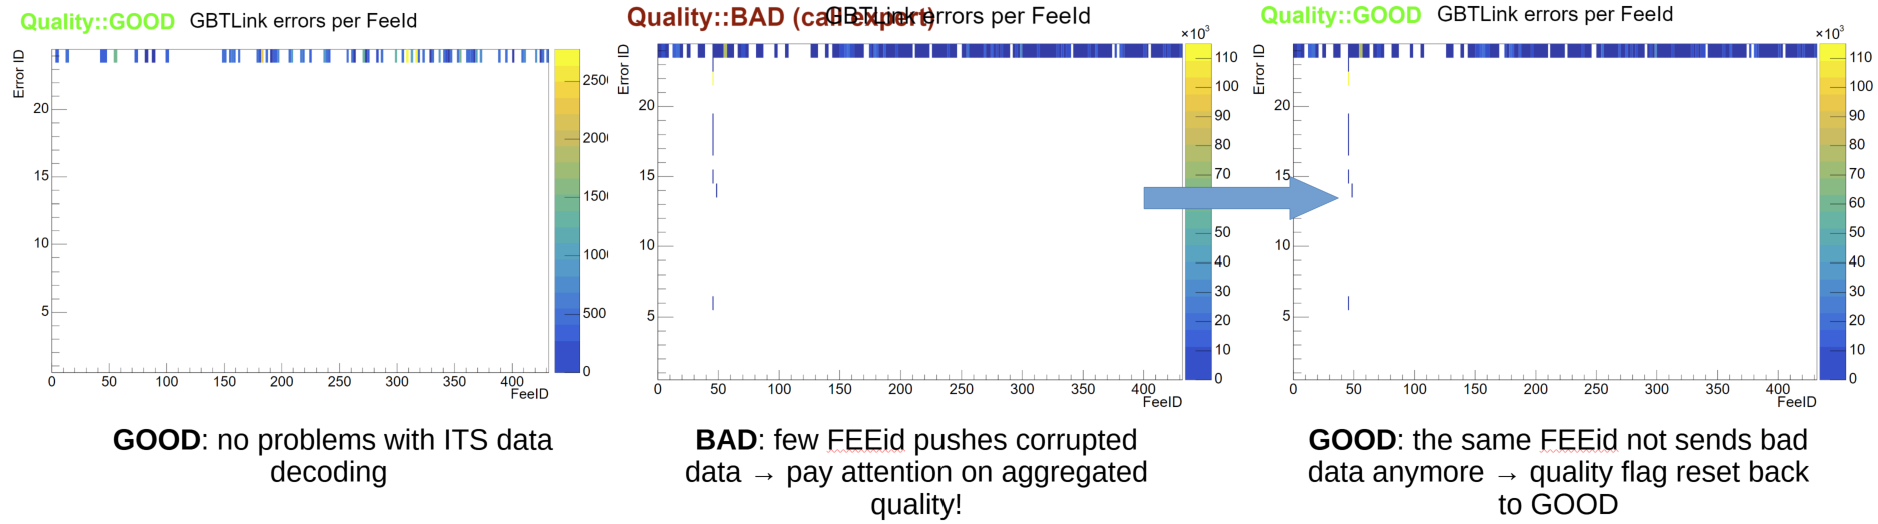
Please call ITS on-call if you see new entries in this plot or in case of BAD Quality message.
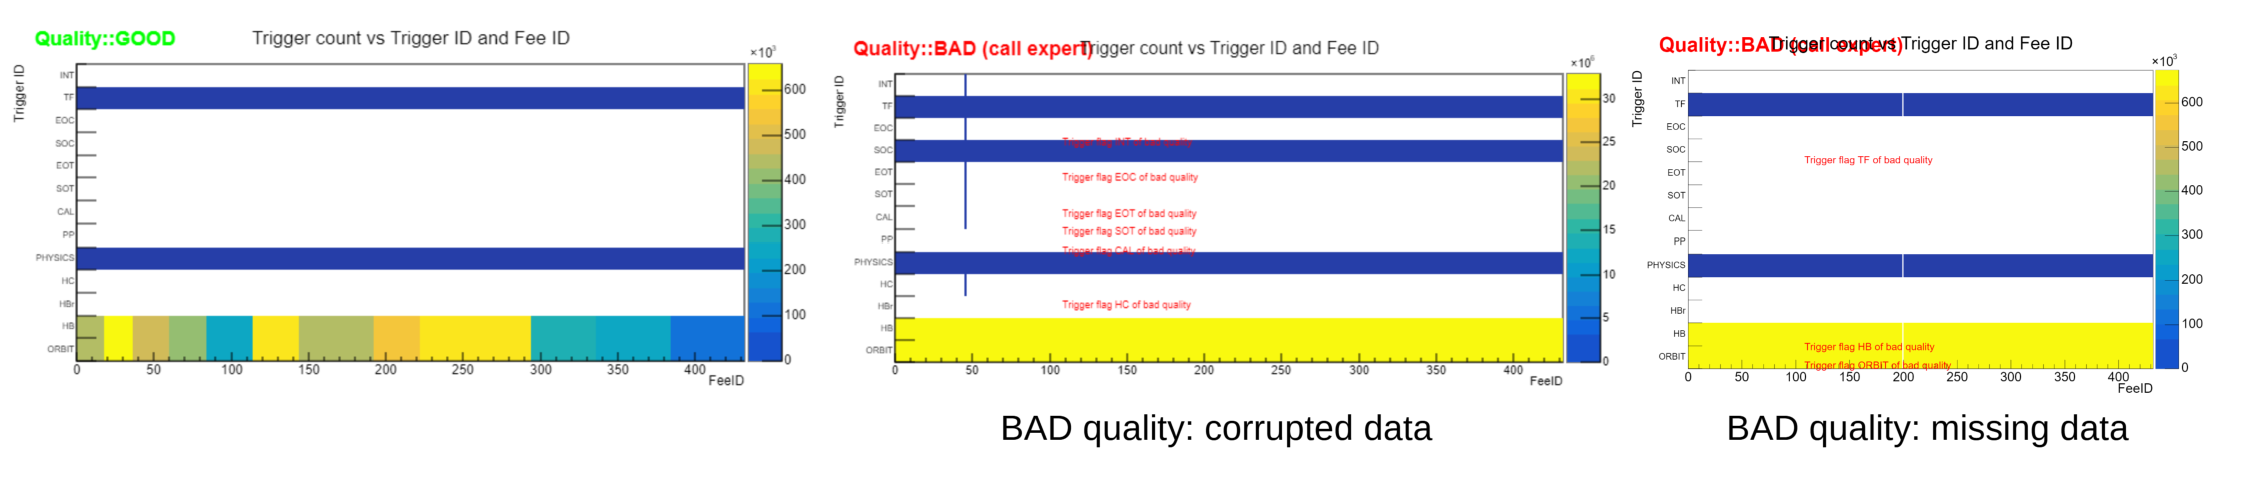
Trigger count vs TriggerID and FeeID#
This plot summarizes the trigger flags from the last QC cycle. The X-axis corresponds to the Front-End Electronics (FEE) ID, and the Y-axis shows the list of all possible triggers that can be received by the FEE. There are a few possible scenarios:
- Left plot (GOOD): Each FEE receives PHYS, HB, ORBIT, SOC, and TF trigger signals. Color variation between different parts of the detector, coming from different half-layers, is possible.
- Middle plot (BAD): Corrupted data from ITS, where unexpected triggers (not PHYS, HB, ORBIT, SOC, or TF) can be observed.
- Right plot (BAD): One of the ITS FEEs stopped sending data, resulting in no triggers being filled for that FEE ID.
In both cases of bad quality call ITS on-call
Lane Status Flag: Not OK (NOK)#
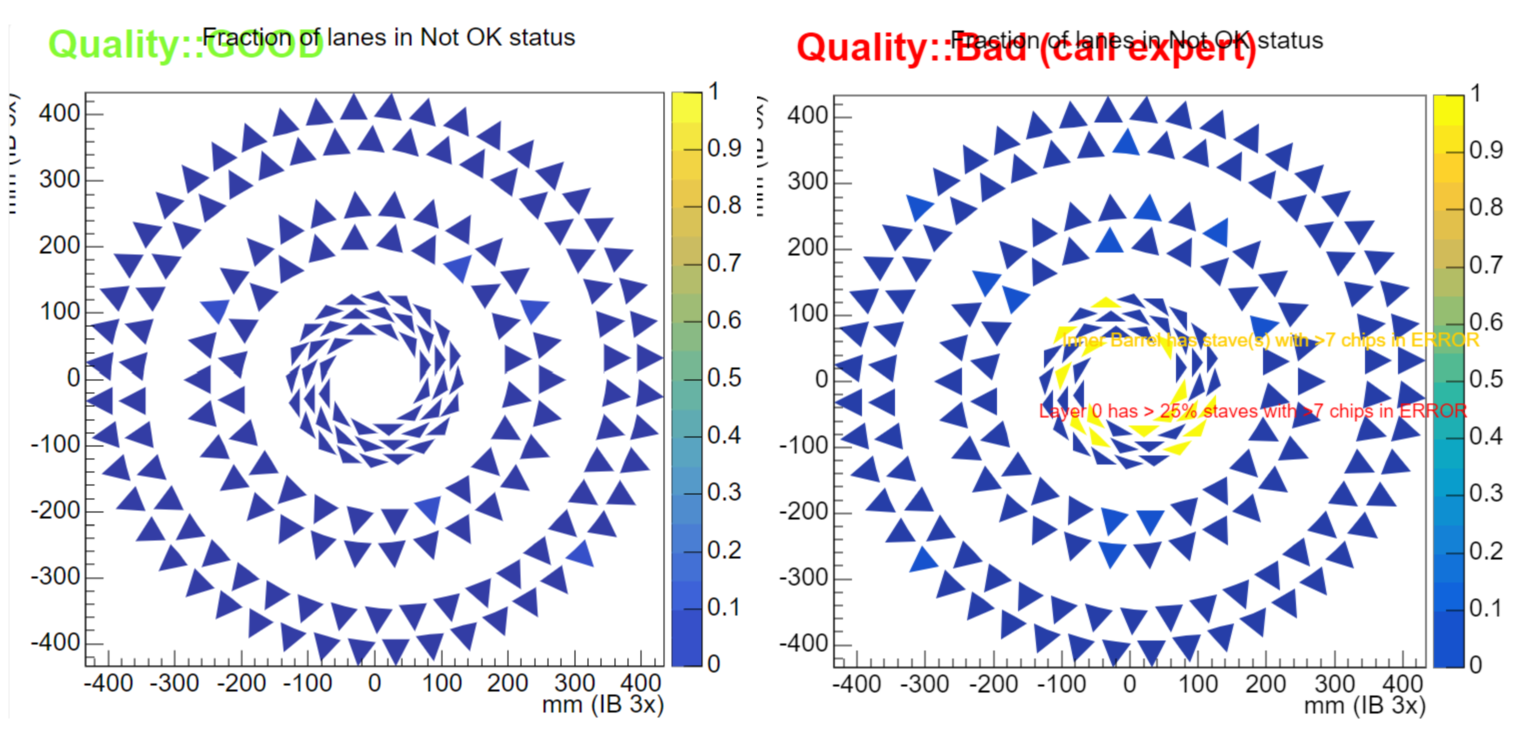
This plot indicates the fraction of lanes (color scale) in a "Not OK" status for each ITS stave, represented by a triangle. A blue triangle corresponds to a stave without any problematic lanes, while staves with errors will be represented by different colors. The GOOD run quality is shown in the left plot, while other quality levels (right plot) may show the following messages:
- Quality: MEDIUM: Middle Layer (ML) or Outer Layer (OL) have staves in ERROR.
- Quality: MEDIUM: The Inner Barrel has a stave with more than two chips in ERROR/FAULT/WARNING.
- Quality: BAD: Layers 0–6 have more than 25% of staves with lanes/chips in ERROR/FAULT/WARNING.
If the BAD quality message is printed, call the ITS on-call.
Number of QC cycles without data from stave#
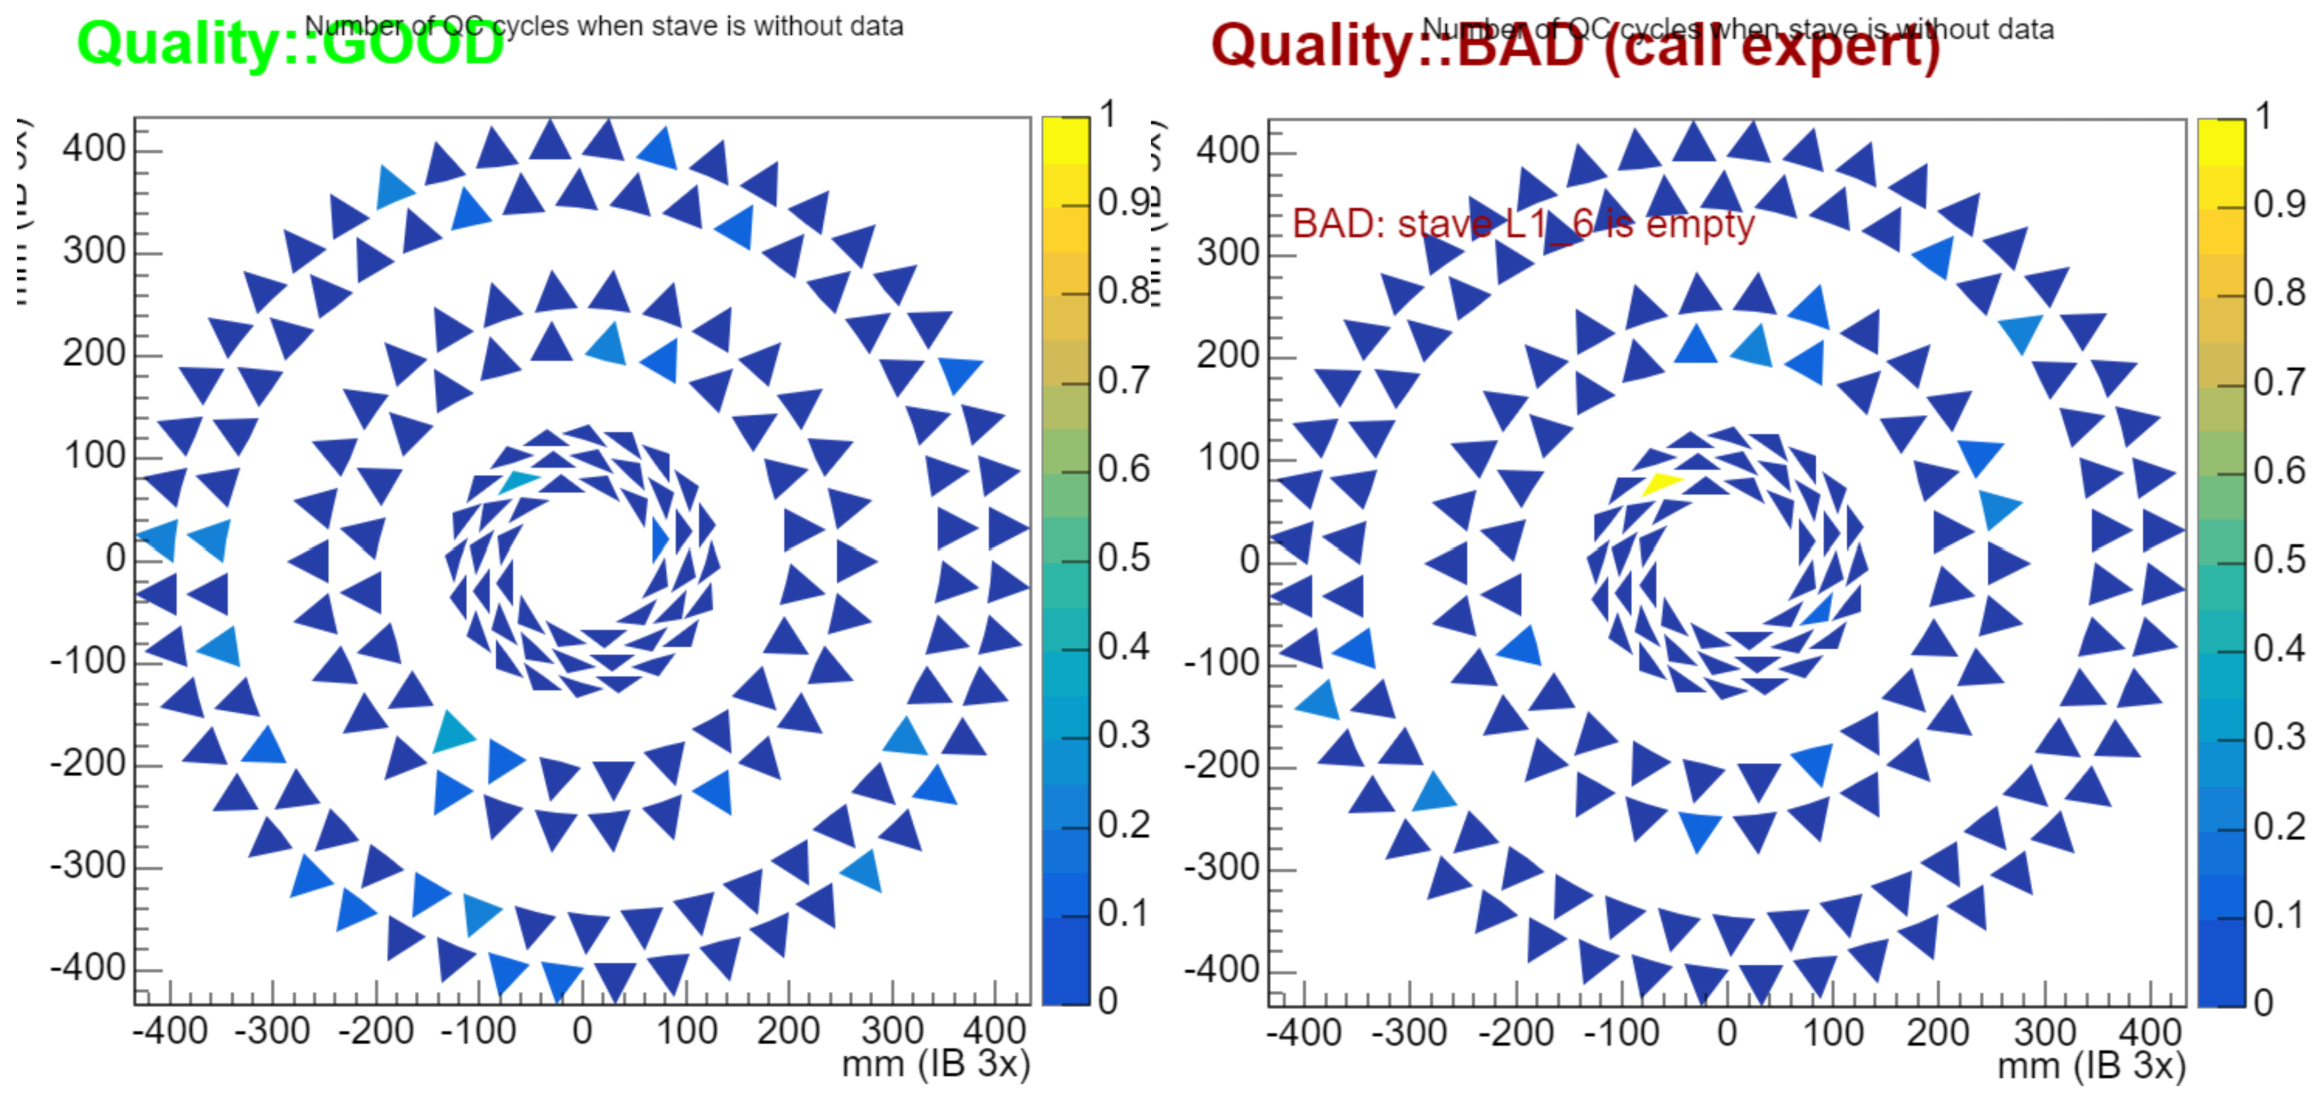
This plot indicates the fraction of consequative QC cycles without data (out of 3) for each ITS stave, represented by a triangle. A blue triangle corresponds to a stave without any problematic lanes, while staves with readout issues are represented by different colors. The GOOD run quality is shown in the left plot, while other quality levels (right plot) may show the following messages:
- Quality: GOOD:
- Quality: BAD: Stave LX_XX is empty
Please, call the ITS on-call in case of BAD quality
Lane Status Global#
[QC on FLP]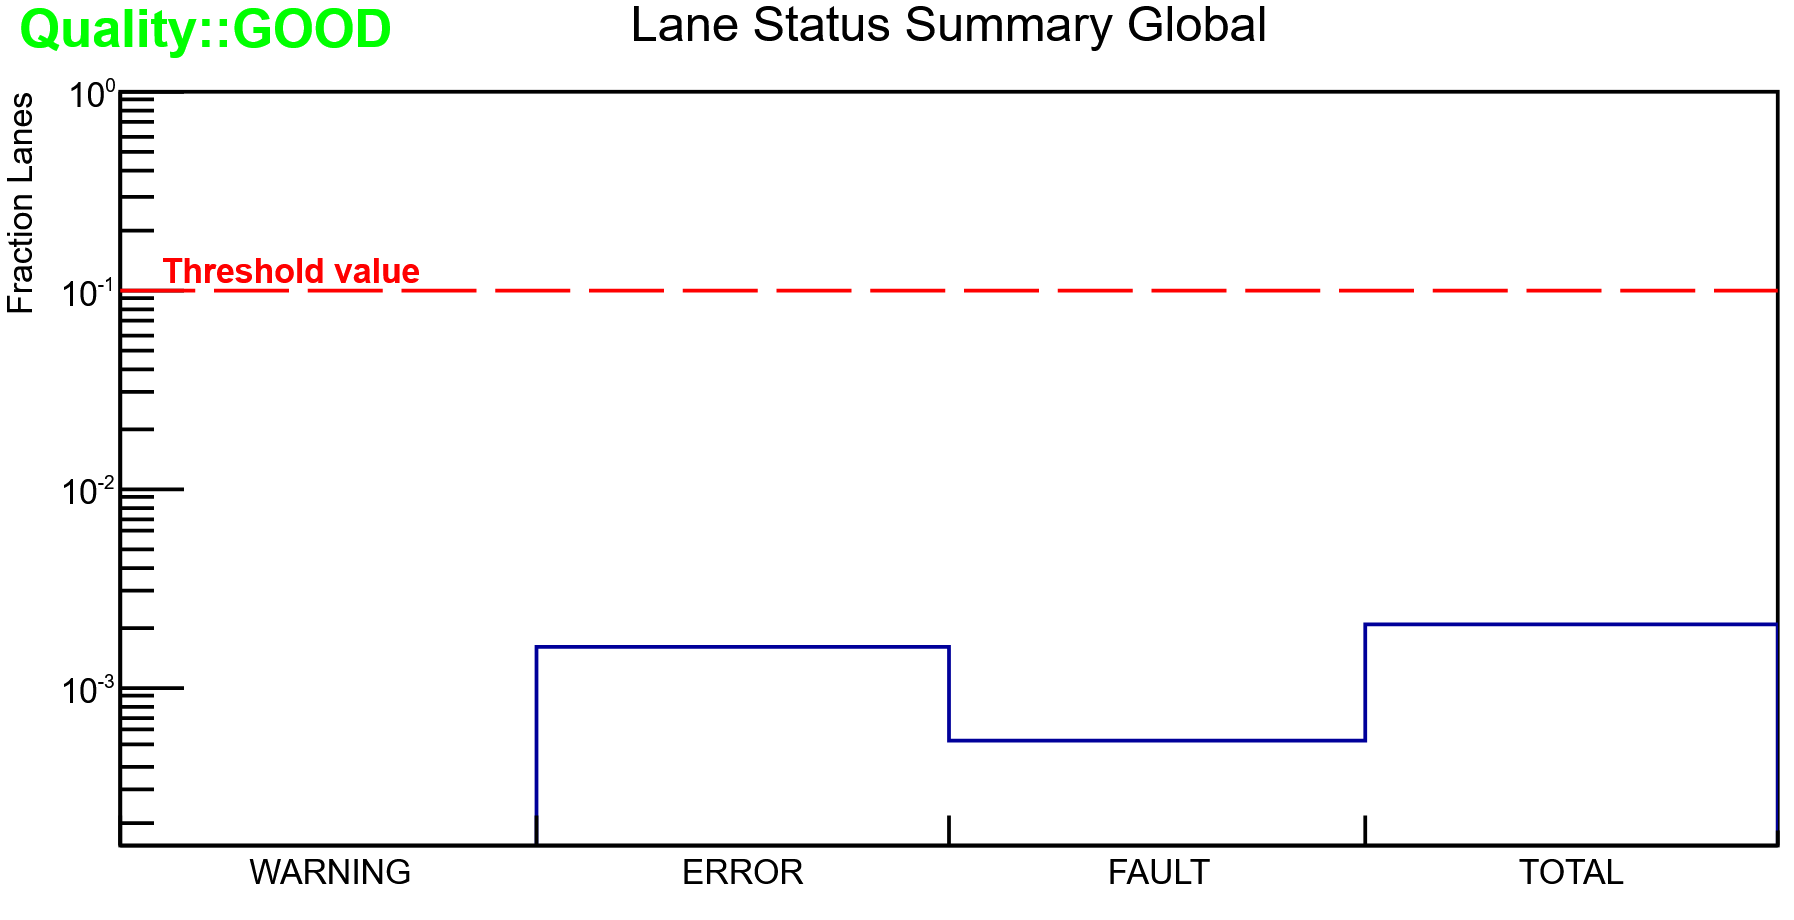
This plot shows the fraction of lanes into ERROR, FAULT, and WARNING statuses. The TOTAL bin gives the total fraction of lanes in any not OK status. The BAD quality will be triggered when the bin value exceeds the 10% threshold.
The following Quality messages can appear:
- Quality::GOOD
- Quality::BAD: >10% of the lanes are bad.
In case of BAD quality messages call the ITS on-call.
ITS Misconfiguration plot#
This plot shows the estimated readout rate for each FEE component of the ITS. All FEEs should display the same estimated readout frequency, as shown in the example figure. Please note that color variations along the Z-axis are acceptable and do not indicate any issues.
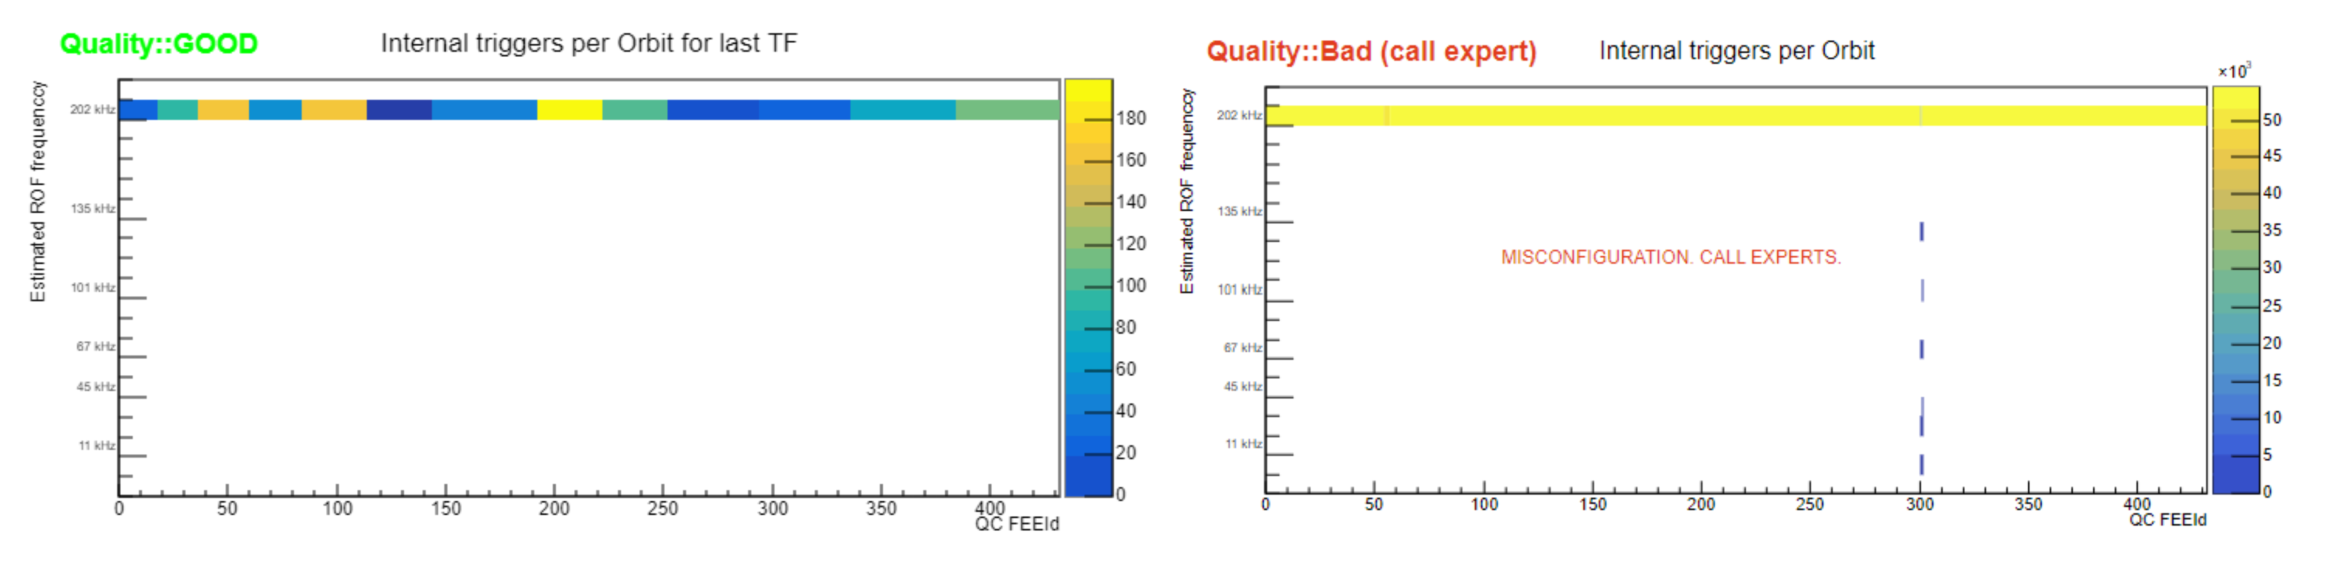
The following Quality messages can appear:
- Quality::GOOD
- Quality::BAD: MISCONFIGURATION. CALL EXPERTS. This bad quality may also be triggered by corrupted data from ITS. In such cases, you will see random bins filled across the entire plot (e.g., see the right plot).
In case of BAD quality messages call the ITS on-call.
Cluster Occupancy overview#
[QC on EPN]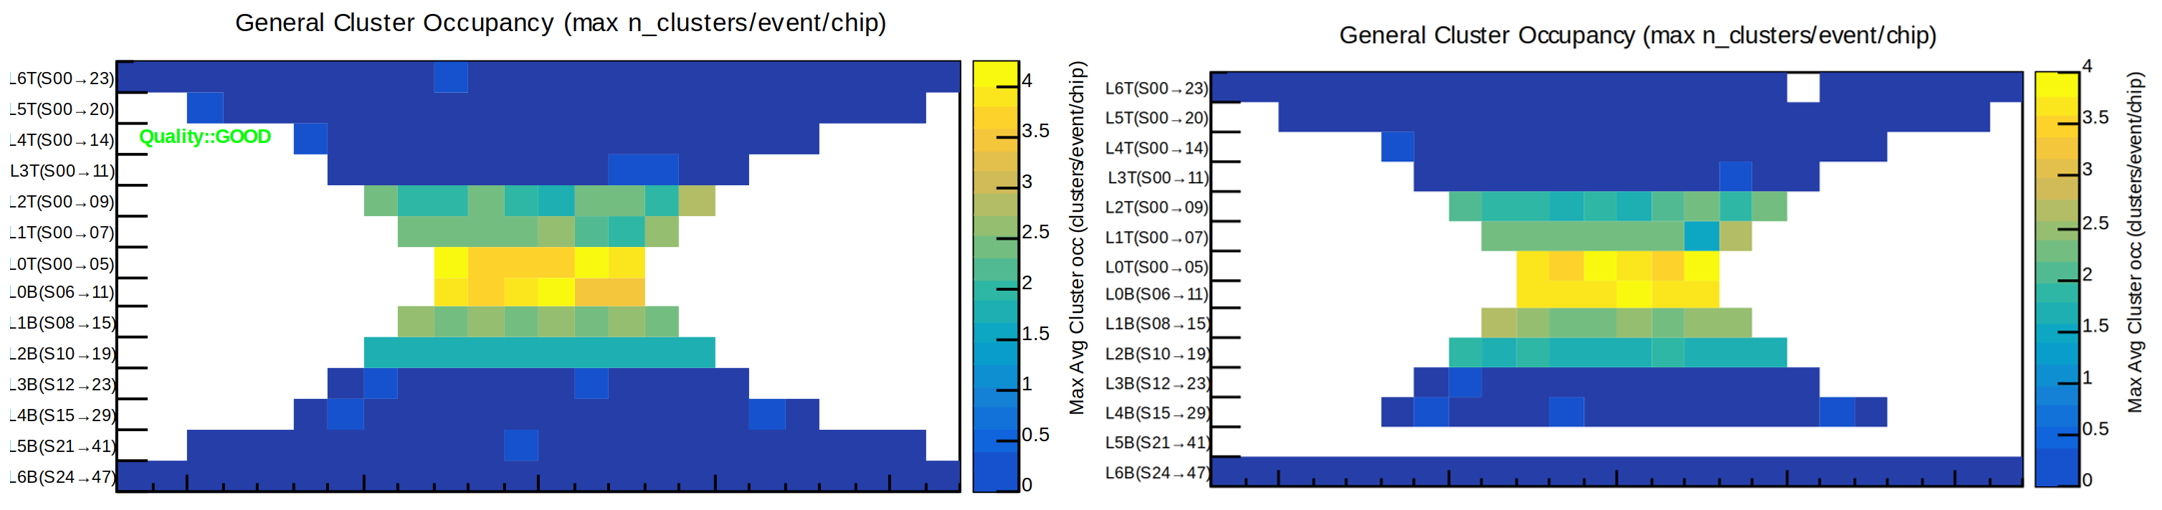
Overview of the cluster occupancy, i.e., number of clusters per event, for each stave (1 bin in the plot). The left figure gives example of the GOOD run, while on the right is the problematic distribution. Check the general trend, i.e. occupancy decreasing when going from the innermost to the outermost layers. This MO can have the following quality messages:
- Quality:: MEDIUM: Layer_Stave has large cluster occupancy
- Quality:: BAD: Layer_Stave has empty stave
Call the ITS on-call in case of anomalies in the plot or if the BAD quality message will appear.
Angular Distribution#
[QC on EPN]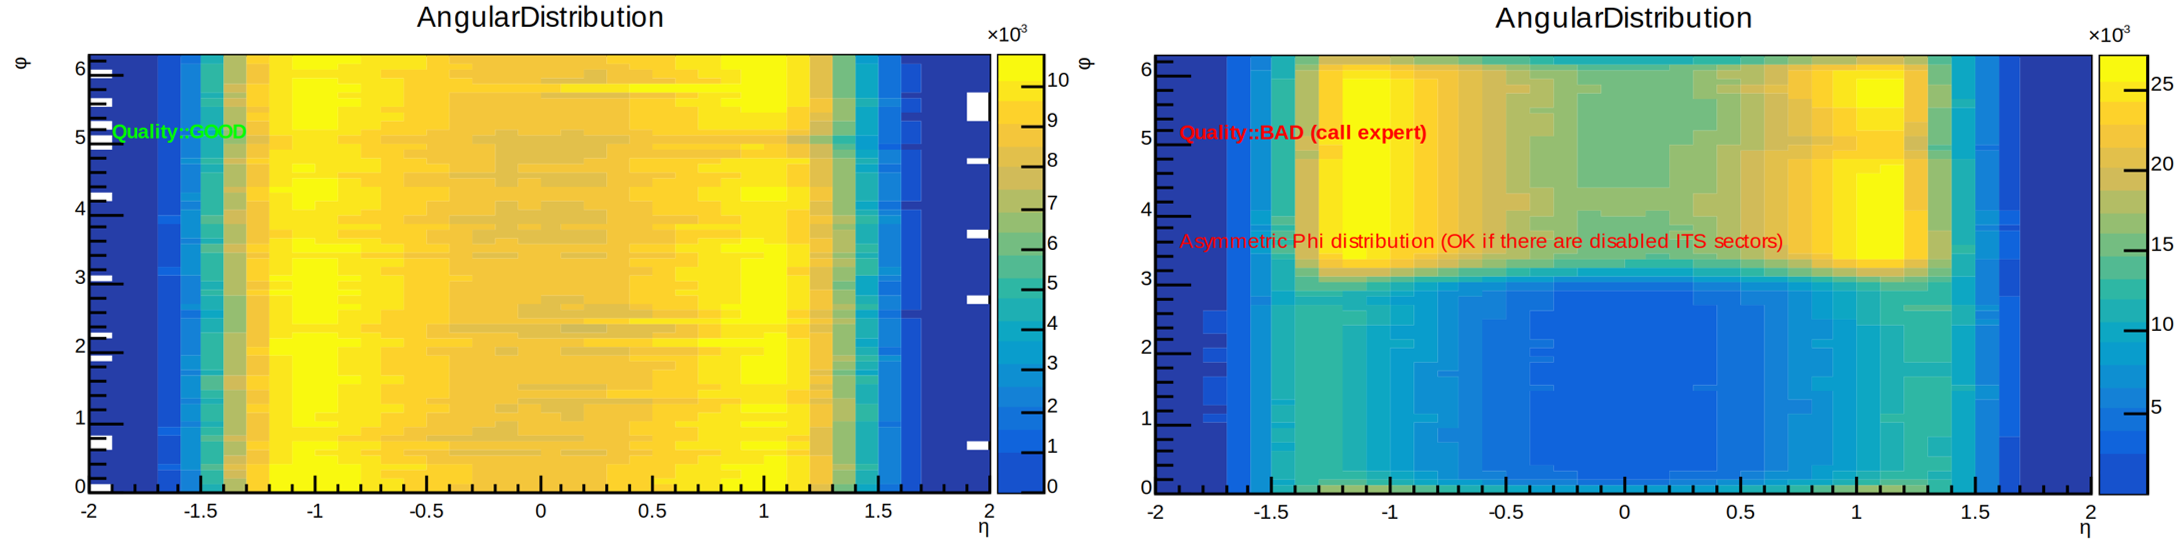
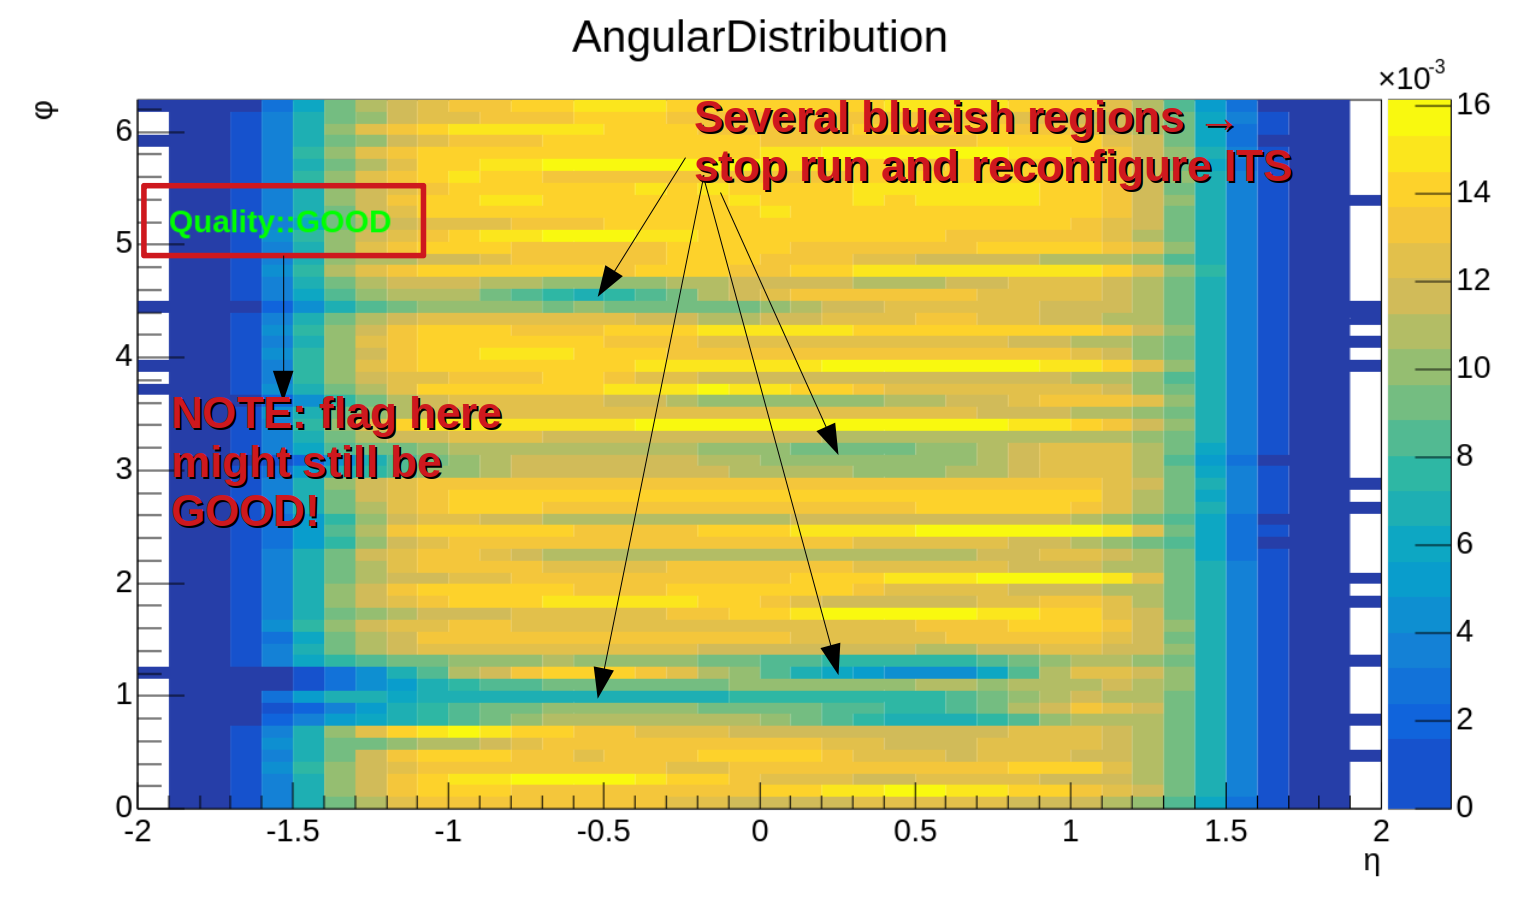
Angular distribution of online reconstructed ITS tracks as a function of phi vs. eta (2D plot).
Possible Quality messages that can appear on the plot during a run:
- Quality::GOOD: plot might still be bad! See example above and look at the arrows in the plot.
- BAD: Asymmetric Phi distribution (OK if there are disabled ITS sectors)
- BAD: Asymmetric Eta distribution (OK if there are disabled ITS sectors)
- BAD: NO ITS TRACKS
Please try to reconfigure the detector (set run type again) in case the quality is BAD or if the plot shows several holes (blue regions in between the yellow parts as shown in the plot above), call ITS on-call is the issue persists. Please call the ITS on-call also if the plot remains empty during the run.
Number of clusters per track#
[QC on EPN]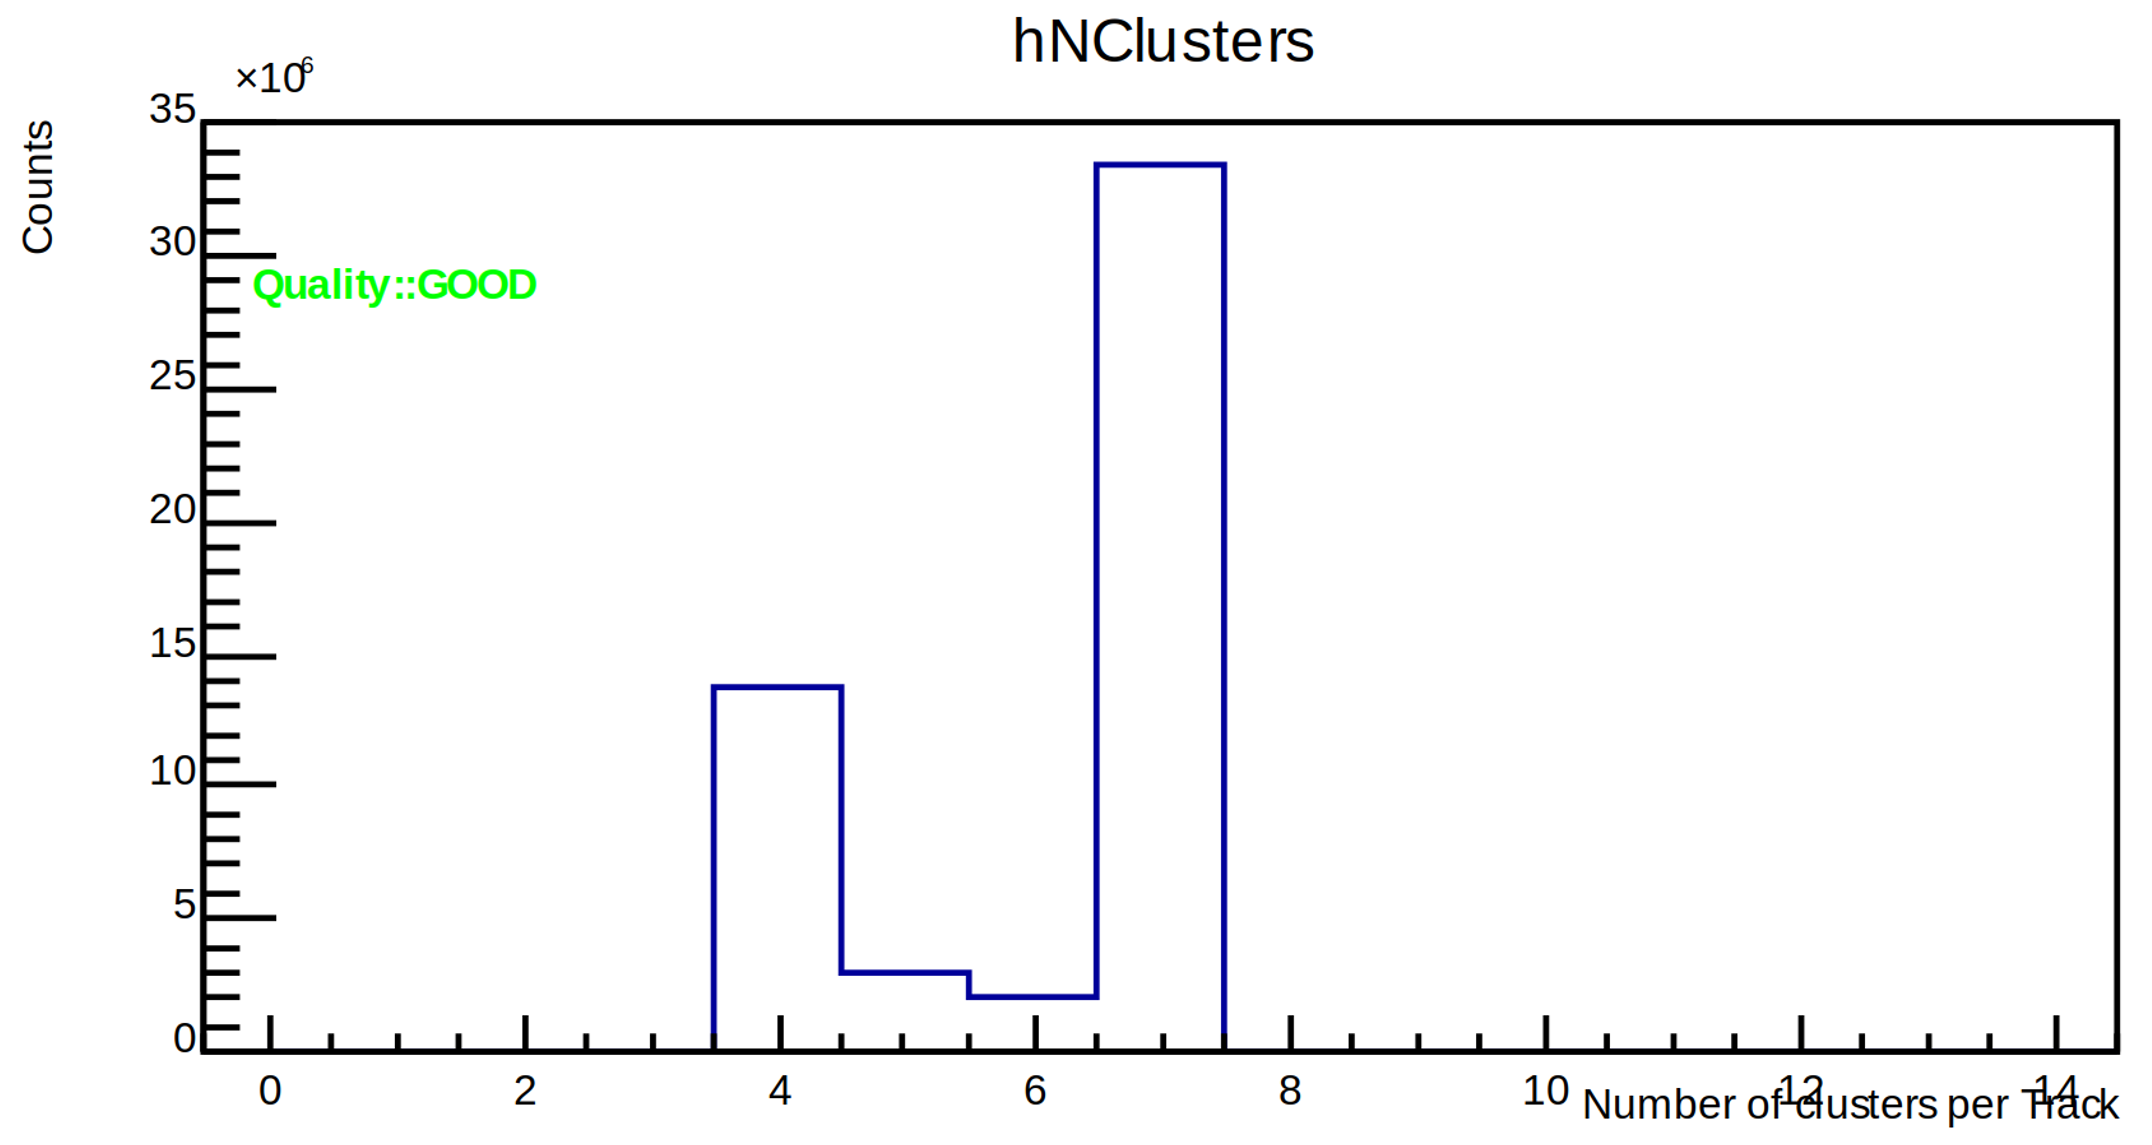
Distribution of the number of clusters per track. The plot shows a GOOD example of pp collisions run. The following messages can appear:
- Quality::GOOD
- Quality::Medium Mean is outside 5.2-6.2, ignore for COSMICS and TECHNICALS
- Quality::BAD: 0 tracks with 4/5/6/7 clusters (OK if it's synthetic run)
- Quality::BAD: NO ITS TRACKS
Call the ITS on-call in case of BAD quality messages, if a completely different plot is obtained, or if the plot stays empty after 5 min of data taking. In case of MEDIUM status, create log-book entry.