PDP shifter documentation#
InfoLogger setup#
-
Link to EPN InfoLogger with default filters for shifters
-
Link to FLP InfoLogger with default filters for shifters
-
You are required to have two browser windows open for the InfoLoggers during your shift. One for FLP IL (for monitor QC and local processing on the FLP farm) and one for EPN IL (for monitoring the global processing). Please use the above links which sets some default filter settings which you should always keep.
-
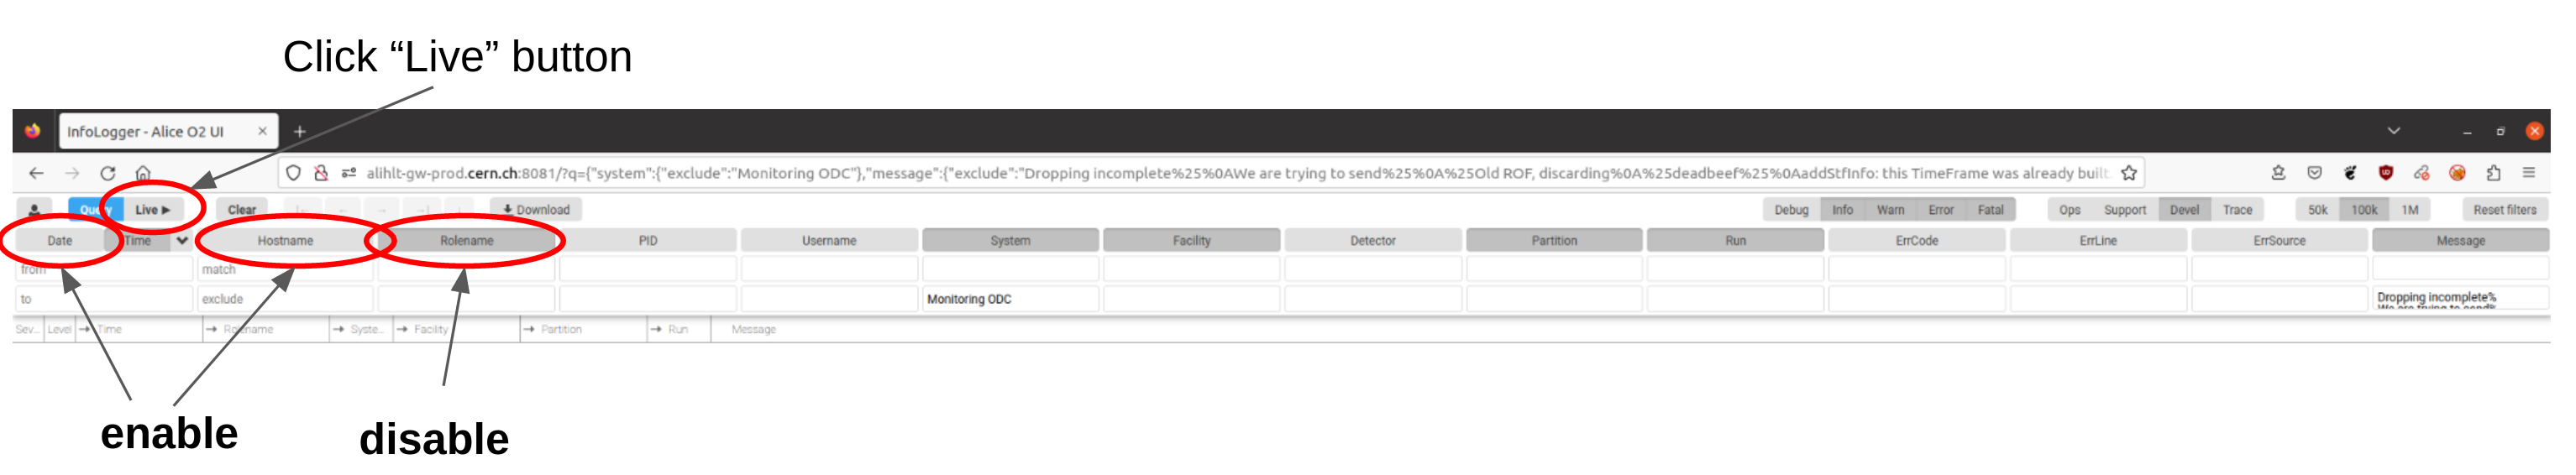
Upon opening the EPN InfoLogger you have to finalize a few settings as shown in the screenshot below.
-
For the FLP InfoLogger the default column selection is fine, so you don't need to change them. Simply click on "Live" to start it.
-
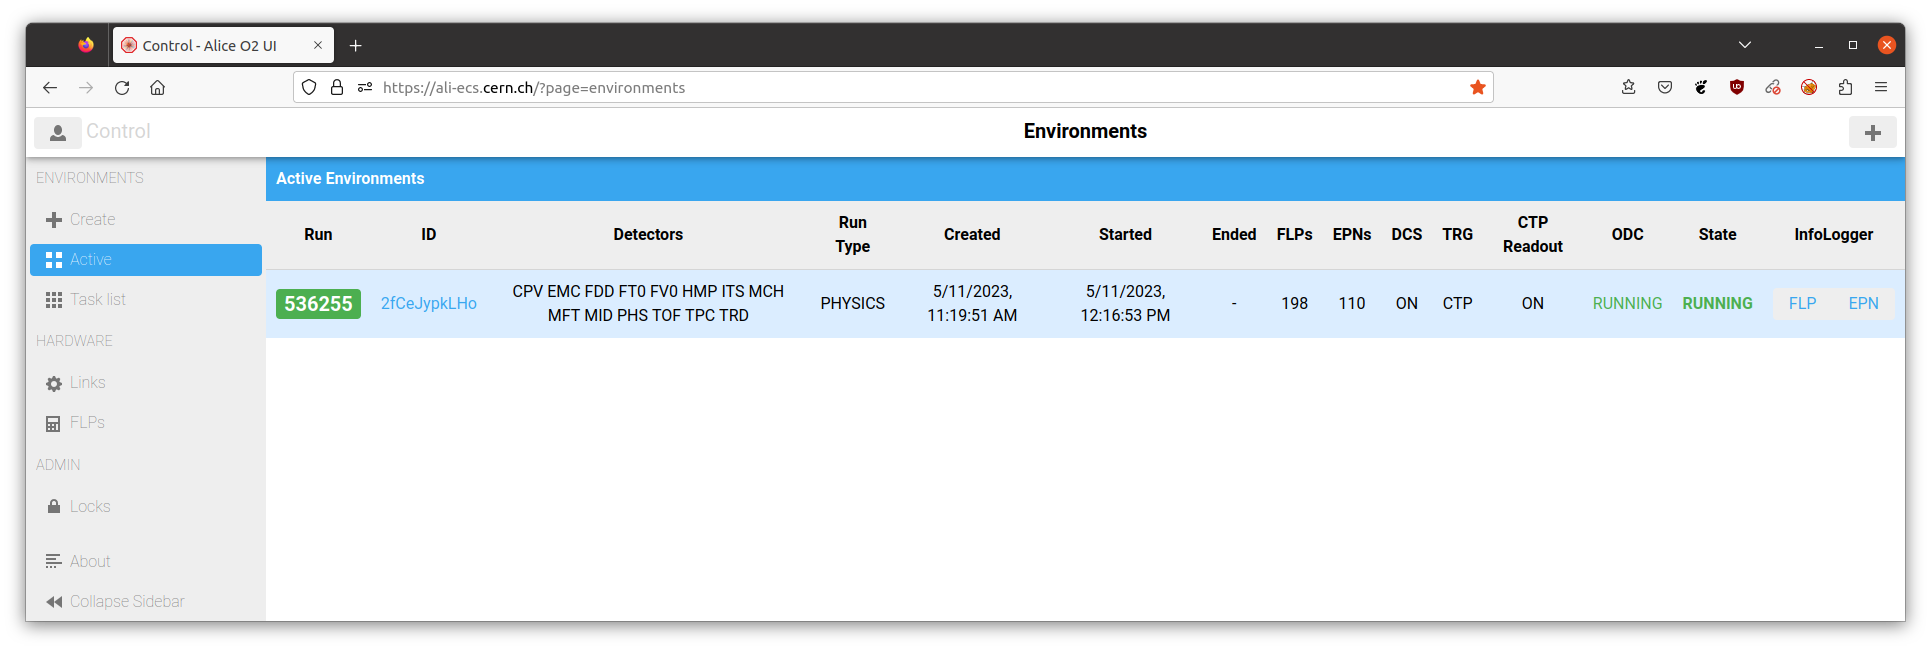
After you have clicked the "Live" button you will receive all messages which pass the predefined filter settings, not yet specifically bound to any run. That means you will also see messages from standalone detector tests. You should filter for the currently ongoing run(s) started by the crew only in order to avoid confusion. You find the run number either in AliECS or in Bookkeeping.
Example for how to retrieve the run number from Bookkeeping:
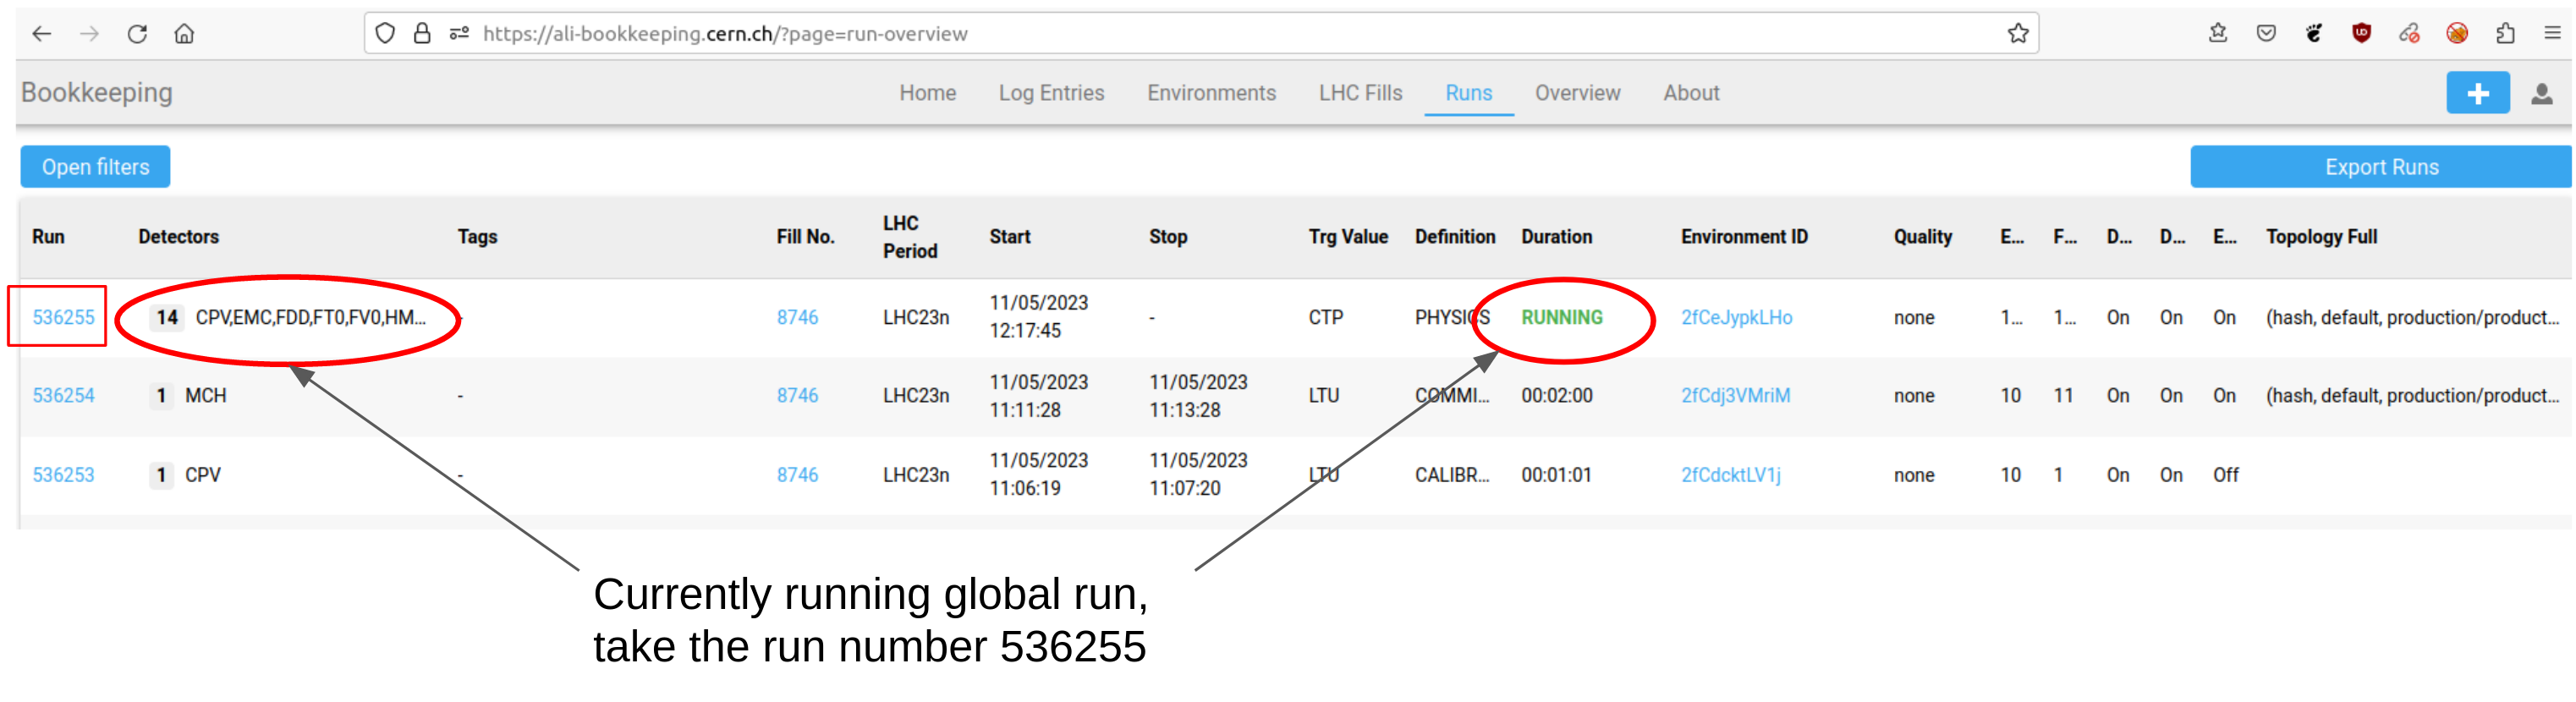
The run number can also be taken from AliECS:
- After you have added the run number, your EPN InfoLogger should look like in the example below
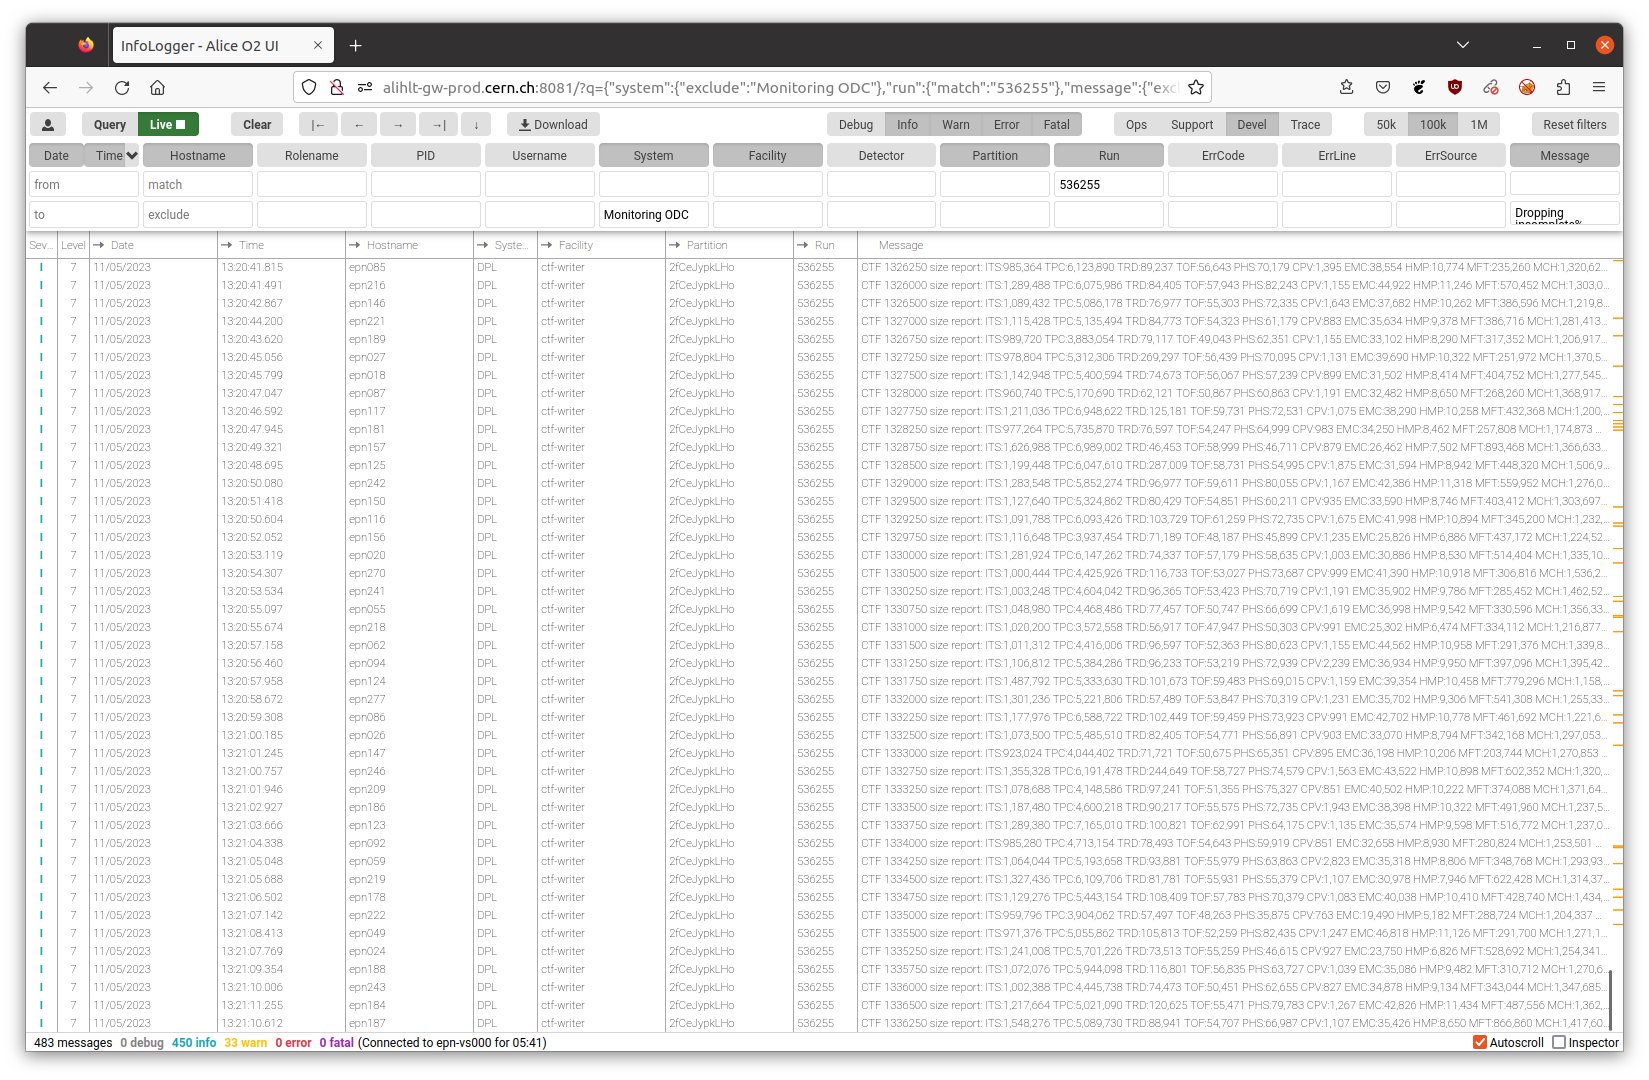
- Notice that there are no errors or fatals visible. In case there appears an error or fatal, there are 2 resources to consult to check first if the issue is either known or if special instructions exist on how to act. For the FLP InfoLogger check the list of known issues of the detector that issues the error. For example if there is an error from FT0 check in FT0/KnownIssues. The second resource is the list of known messages. In case that message is neither contained in the list, nor in the list of known issues for the given detector, create a bookkeeping entry. See below for an example how to do it.
Hint:
You are only required to act upon error or fatal messages. Therefore you can also disable the info and warning messages completely. It is a matter of taste. I like to see that something is going on, so I have them enabled on the EPN InfoLogger. But this can also make errors or fatals easier to miss. Up to you if you keep infos and warnings enabled or disable them. For the FLP InfoLogger there are even more info/warning messages, so here it is recommended to keep only error/fatal messages by default.
-
When the run is stopped and a new run is started:
- press the green "Live" stop button
- press the "Clear" button next to it
- enter the new run number once the next run has started
- press the blue "Live" start button
-
When a second run is started in parallel:
- simply add the new run number separated by a space into the run number filter field
How your bookkeeping entry should look like#
An error or fatal message appeared for which no specific instructions exist in the list of known messages. All messages need to be followed up, even though they might not require immediate action by the experts. For example a crashing process can mean that we are loosing one EPN server for the rest of the run, but the remaining EPN servers might be sufficient to cope with the input rate. But when we go to higher rates or to PbPb then the frequency of errors might increase and this can become a blocker.
To help the experts with their investigation, your bookkeeping entry should always contain the full line of the IL GUI (date/time, hostname, system, facility, partition, run and the message itself). Simply mark it in the browser with your mouse, press Ctrl+C and Ctrl+V in the bookkeeping entry. Sometimes the pasting directly does not work and bookkeeping adds some HTML code. In that case it helps to paste the text first into an editor window (e.g. gedit) and from there into bookkeeping.
An example bookkeeping about an error which is not in the list is here.
Note that in this case next to QC/PDP Shifter, PDP and QC also FT0 was tagged. This is because from the IL message it was clear which system was affected (detector field lists FT0). In case you manage to guess the system from the IL this is very good and you can tag the system as well as was done above. If not, don't worry - we will forward it in that case.
Hint:
Remember to add the run number to the bookkeeping entry.
InfoLogger GUI#
Roberto has created some nice documentation slides on the usage of the InfoLogger GUI. They are used in the ECS shifter training, but you will be using the InfoLogger in the same way as he/her. You can find the slides on indico
Current default filter settings, for reference#
For EPNs#
Blacklist only
List of filter messages:
%deadbeef%
addStfInfo: this TimeFrame was already built.%
Wrong order/duplication%
%data specs, missing data specs%
Could not register to ServiceDiscovery%
Not all EMC active links contributed in global BCid%
%Initial matrix not pos.def%
For FLPs#
Whitelist of systems:
DPL QC
Blacklist for messages:
Received bogus oldest possible timeslice%
Wrong order/duplication%
Cannot parse boolean%
Grafana#
The general overview Grafana dashboard for the EPN farm looks like this:
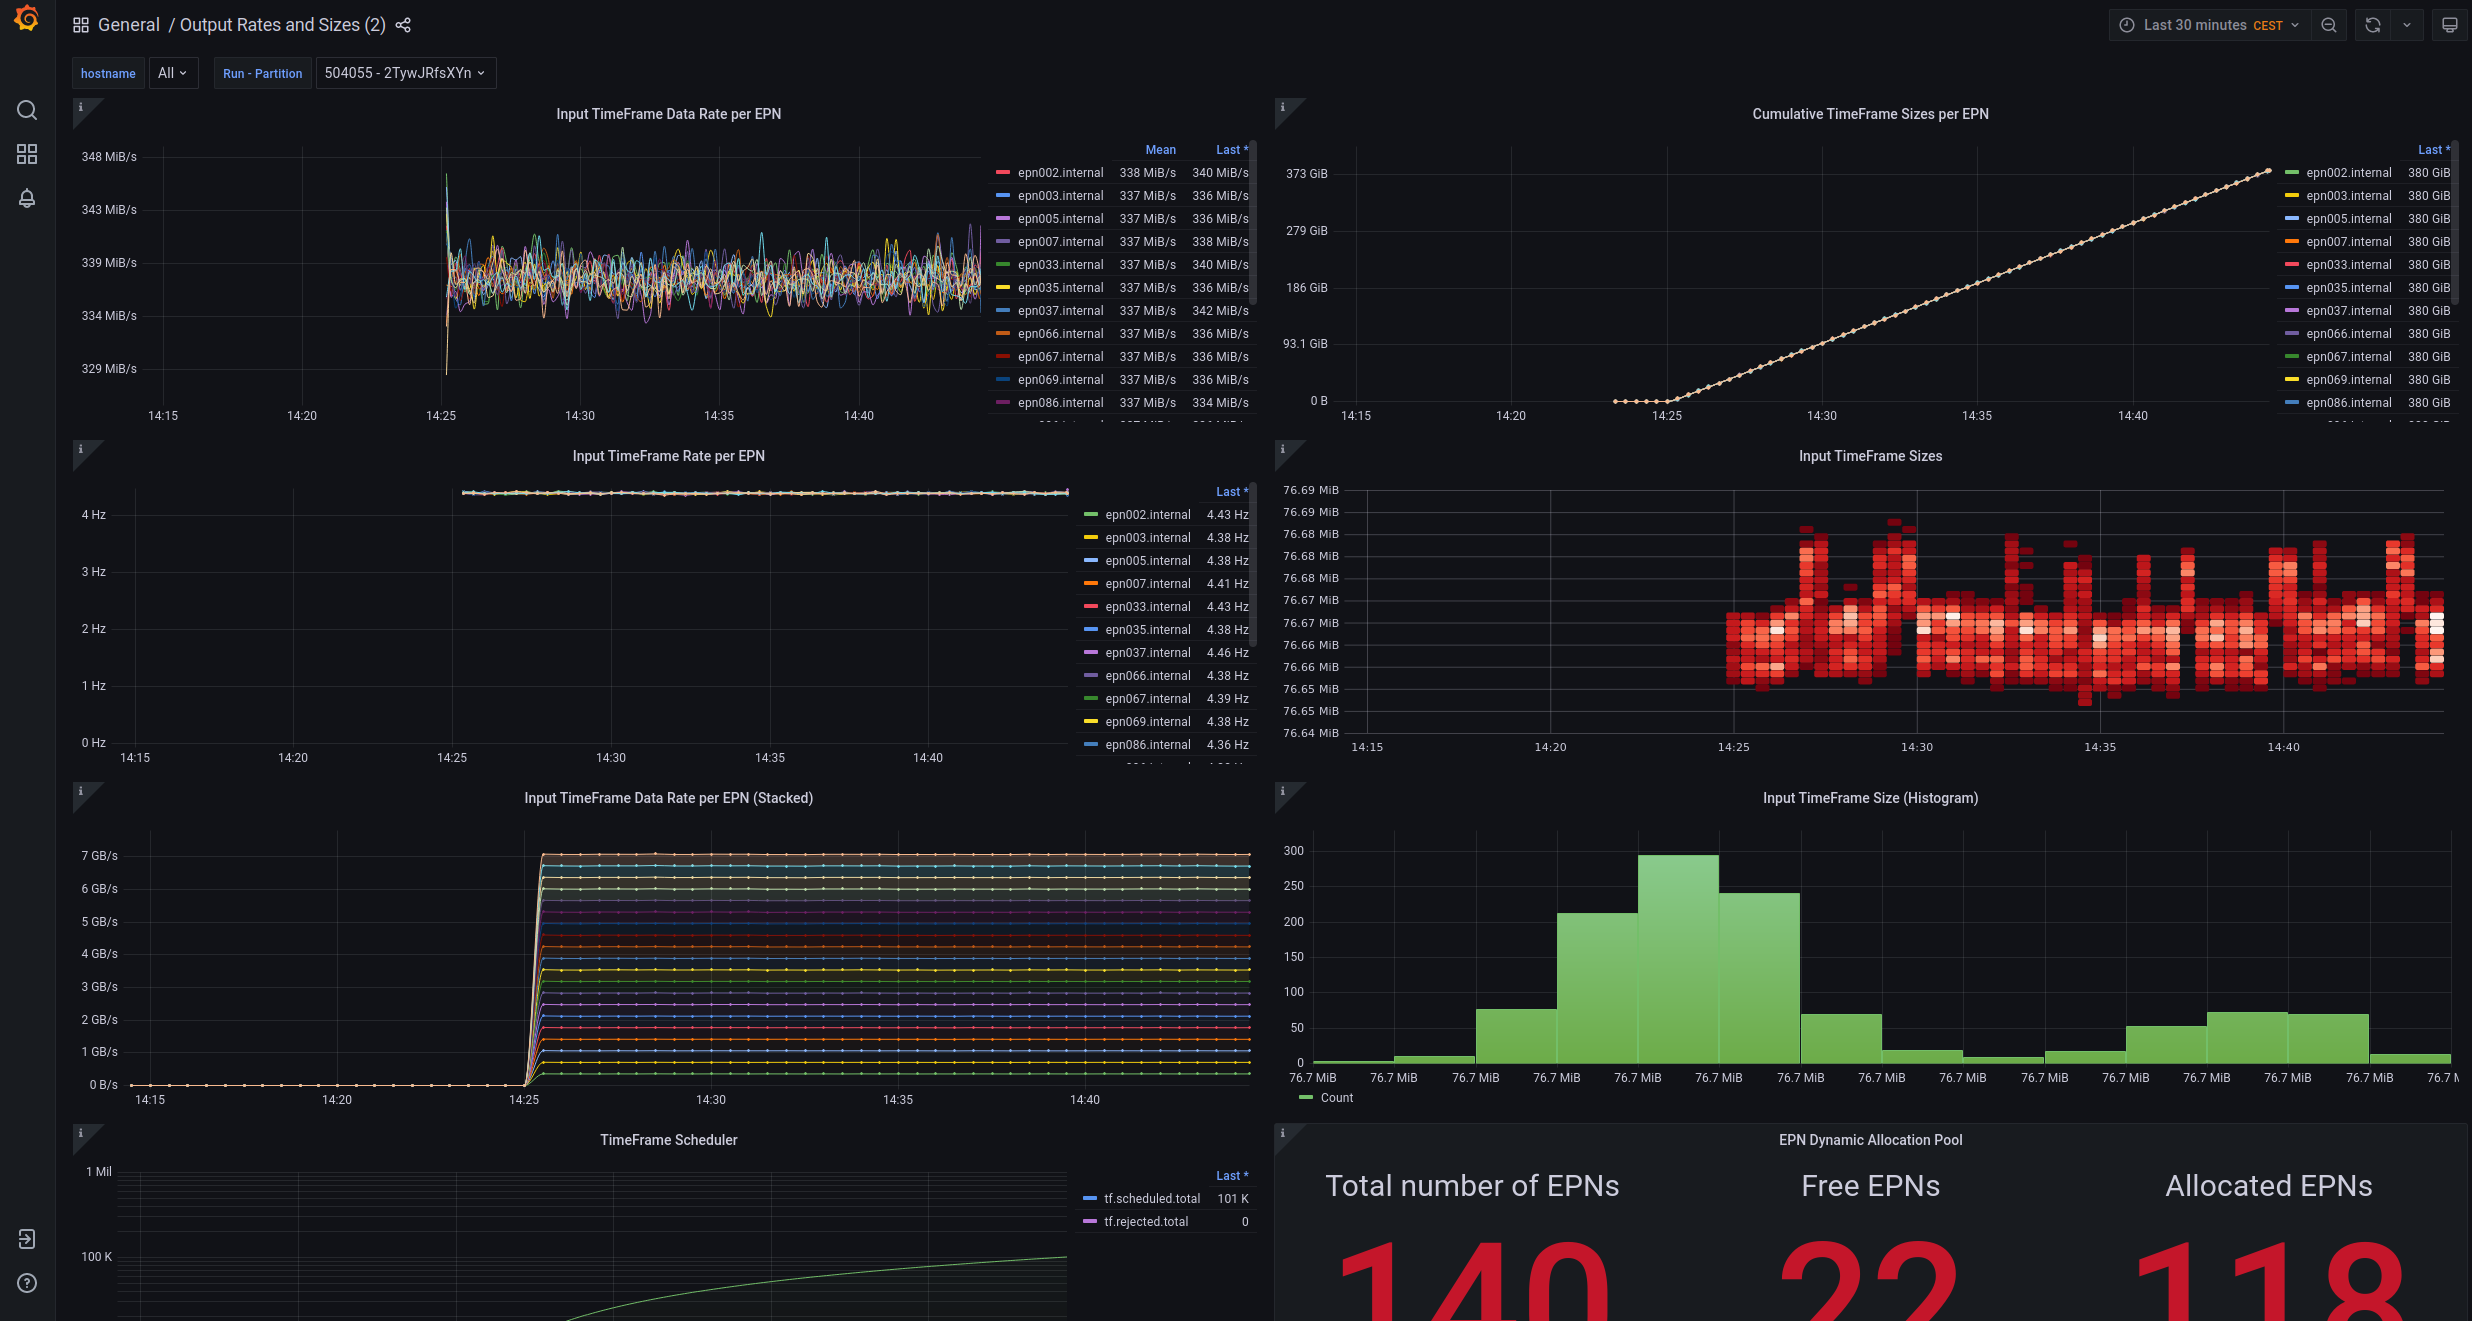
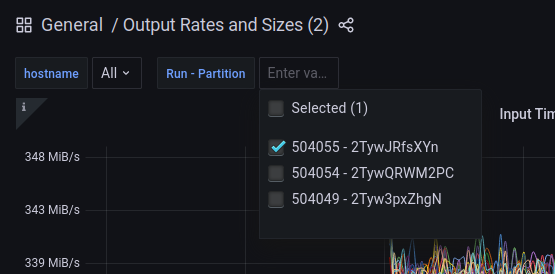
In the upper left corner you can select a run number. Only metrics from EPNs which are enabled for the chosen run(s) are displayed:
You can also select the time range and the interval for automatic updates of the graphs on the upper right corner of the page.
A lot of information can be taken already from the two plots on the top:
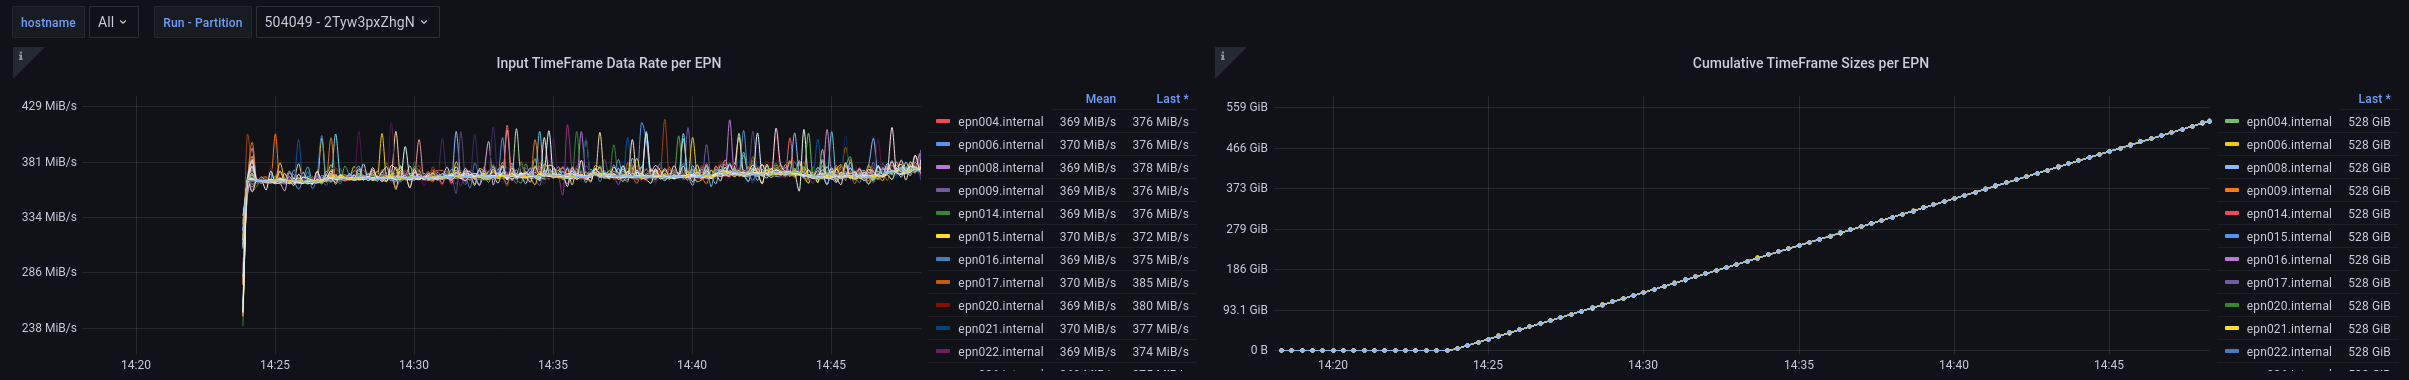
The input TF datarate per EPN should be more or less constant for all EPNs included. The cumulative TF size per EPN is basically the integral of the plot on the right. It should be rising with a constant slope. If an EPN crashes it will show up as a horizontal line from the time of the crash. That way you can identify which EPN failed at what time. In case this happens, notify the Shift Leader. In case of too many failing EPNs you might be asked to call the PDP oncall.
Note:
- in case a run is ongoing and the EPNs are included in the run the Grafana dashboardsshould not be empty. If they are please double check that you have selected the correct run / partition and that you are looking at time ranges of about 15 minutes. If after a few minutes the plot remains empty call the EPN oncall.
Advanced monitoring options#
There are many more dashboards available then you have to watch closely during your shift. In case you want to investigate an issue further. For example a single EPN has crashed which is not problematic for the ongoing run and you have notified the Shift Leader already. You can check the metrics from that specific node to get an idea of what might be the issue. In case other EPNs crash as well this can help the PDP oncall.
This Grafana dashboard shows detailed DPL metrics for each individual node: https://ali-grafana.cern.ch/d/GVh_uHlGz/dpl?orgId=1. Select the Datasource (FLP or EPN), the hostname and the device you would like to check (you can also select all devices).
Here is an example of a process which had a memory leak:
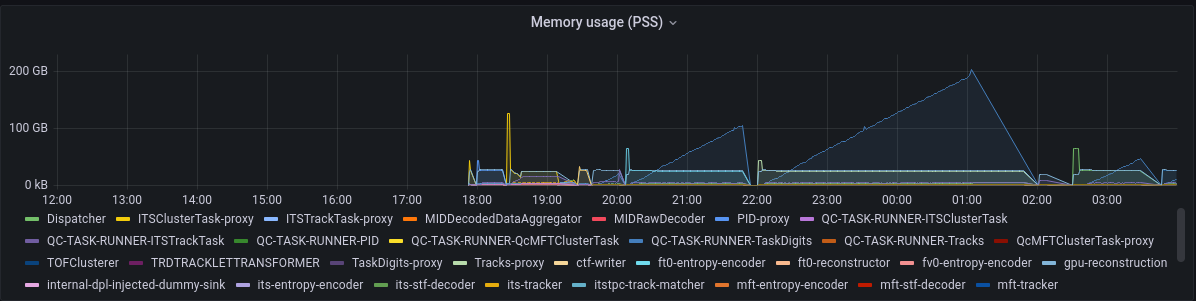
The memory usage of the task "QC-TASK-RUNNER-TaskDigits" continuously increases. If there is an issue like this you will not be able to fix it as oncall. You can only ask the shifters to exclude the involved detector/task from the workflow and notify the detector expert or SRC to look into that problem.