ITS#
General considerations#
If any of the plots listed on this page remains empty during a run or its timestamp and run number are not up to date, please call the ITS on-call.
Error count vs Error id#
[QC on FLP]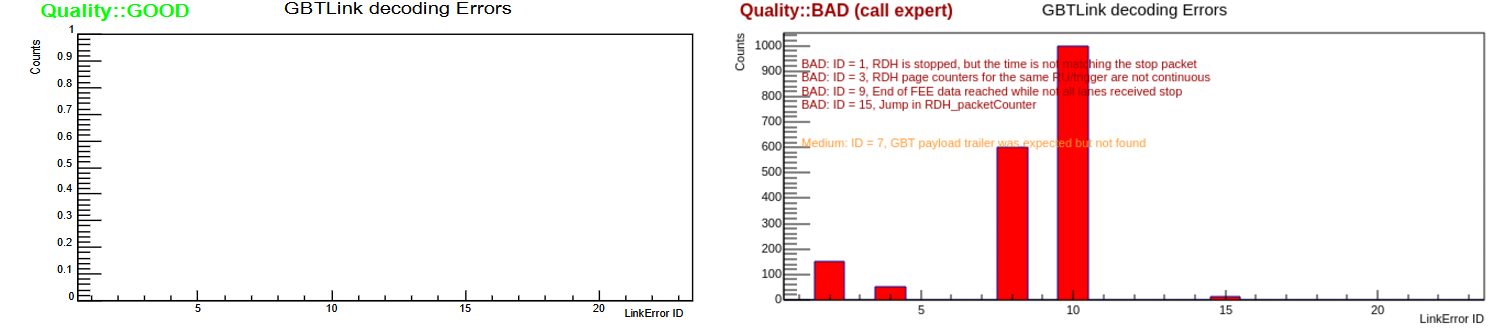
The total number of decoding errors (the error ID is on the x-axis). The left figure provides an example of a good case, while the right corresponds to run with BAD quality;
The BAD quality flag will be triggered when a number of decoding errors exceed some limit; MEDIUM quality corresponds to the case when the number of errors is non-zero, but not significant for the BAD run. The following quality messages can be printed on the plot:
- Quality::GOOD
- Quality:: BAD: "definition of error ID"
- Quality:: MEDIUM: "definition of error ID"
If the number of error with a certain ID show a BAD quality message, call the ITS on-call. In case of the MEDIUM quality, create a log entry linked to run and with tag = ITS.
Please ignore the last bin of this plot. The increase of counts there should be neglected.
Trigger count vs TriggerID and FeeID#
[QC on FLP]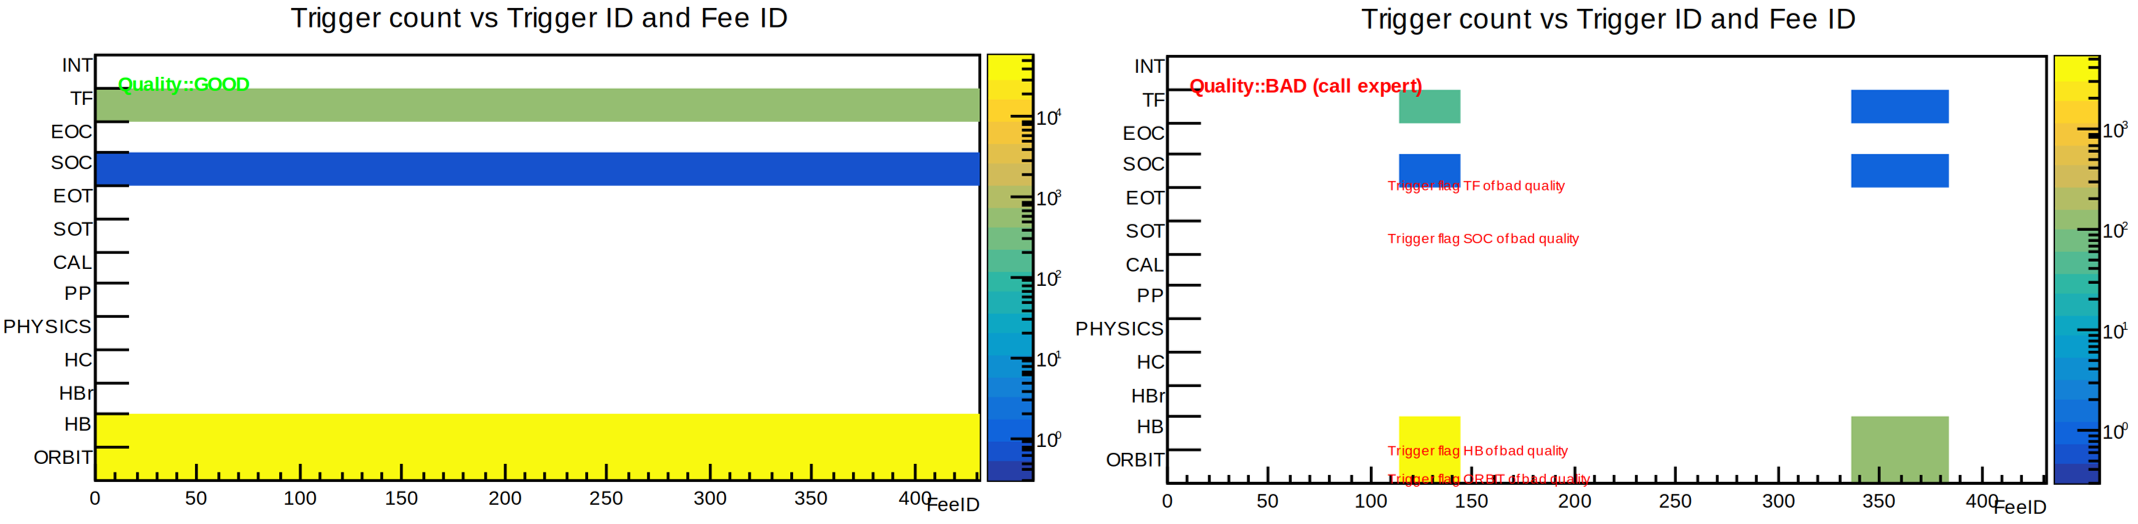 Plot summarizing trigger flags. The X-axis corresponds to the ID of Front-End Electronic; the Y-axis shows the list of all possible triggers that can be received by FEE. The coloured scale represents the counts in each bin. During physical run, we expect that all FEEs receive HB, ORBIT, SOC and TF trigger signals. The GOOD run is shown on the left panel, while the problematic one is depicted on the right. QC can plot the following error messages:
- Quality::GOOD
- Quality:: BAD: Trigger flag (TRIGGER_NAME) of bad quality
call the ITS on-call in the case of BAD quality messages and also in the following cases:
- there are x-bins without entries (i.e., vertical white lines on the plot)
- entries are present in the empty lines in the example plot above.
- the plot is completely empty
Ignore the quality message about the SOC trigger for the SYTH run type
Cluster Occupancy overview#
[QC on EPN]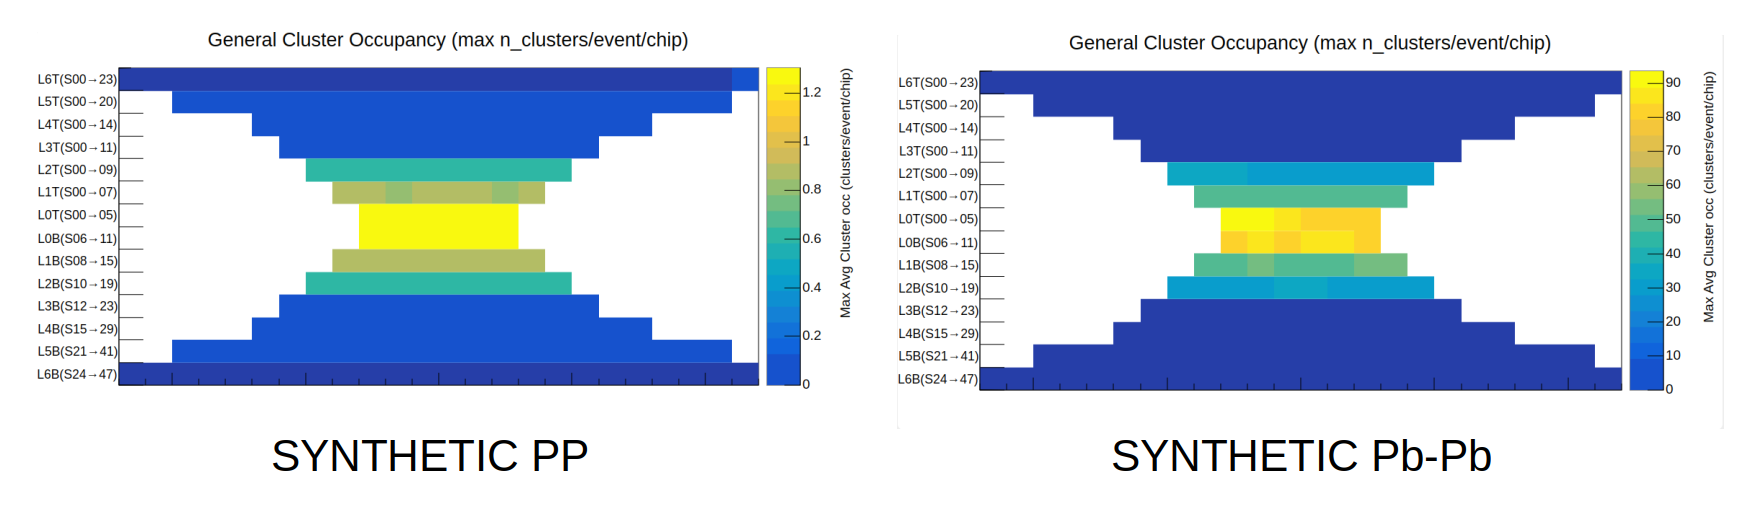
Overview of the cluster occupancy, i.e. clusters per event, for each stave (1 bin in the plot). Good example for current synthetic pp (left) and synthetic Pb-Pb (right) are provided. Note the different order of magniture for the z axis. Check the general trend, i.e. occupancy decreasing when going from the innermost to the outermost layers. QC provides the following quality messages for this plot:
- Quality:: MEDIUM: Layer_Stave has large cluster occupancy
- Quality:: BAD: Layer_Stave has empty stave
In particular, in synthetic runs you will see messages about larger cluster occupancy in different layers.
call the ITS on-call if the plot is different from example.
Angular Distribution#
[QC on EPN]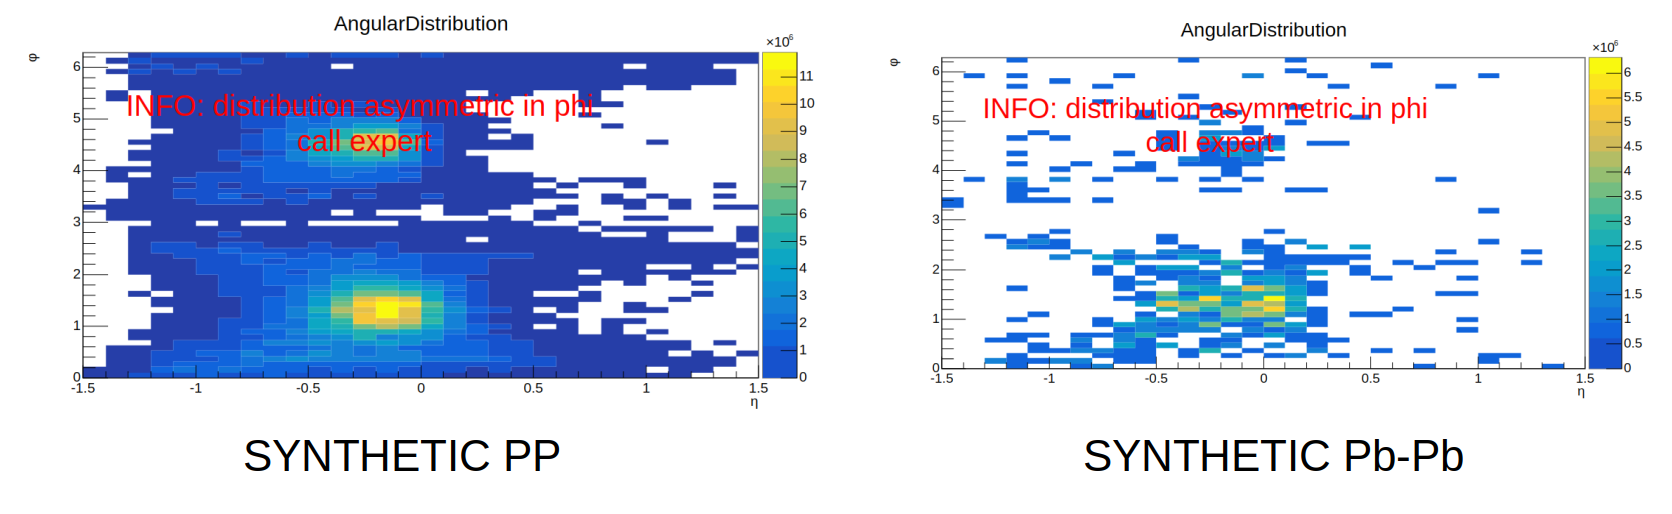
Angular distribution: phi vs eta (2D plot) of online reconstructed tracks. Example of GOOD plots for synthetic pp (left) and synthetic Pb-Pb (right), no action needed in this case.
Possible Quality messages that can appear on the plot during a run:
- Quality::GOOD
- BAD: Asymmetric Phi distribution (OK if there are disabled ITS sectors)
- BAD: Asymmetric Eta distribution (OK if there are disabled ITS sectors)
- BAD: NO ITS TRACKS
Please call the ITS on-call if plots look much different from example.
Number of clusters per track#
[QC on EPN]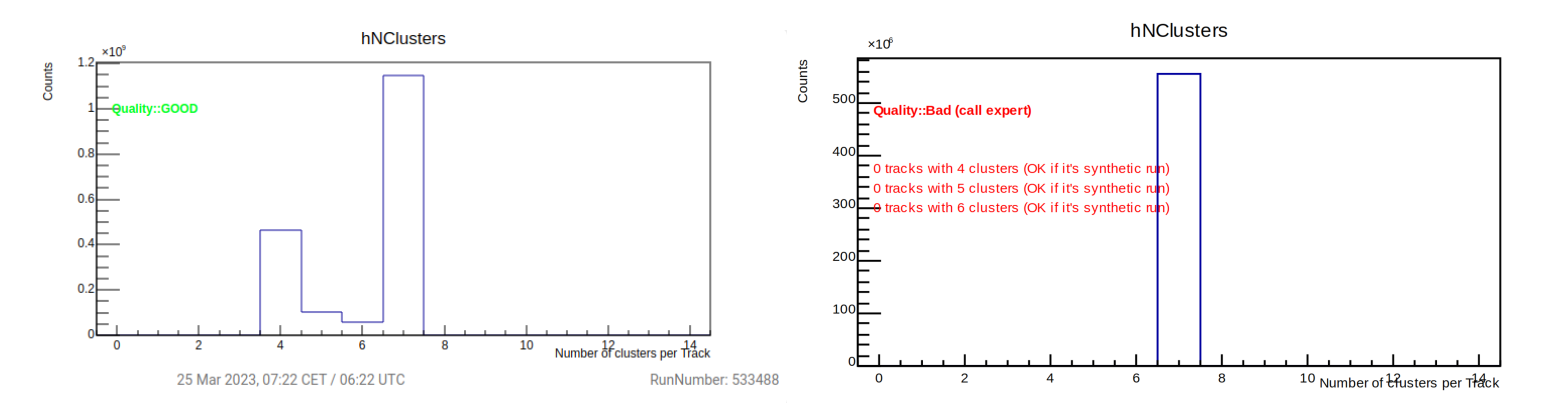
Distribution of the number of clusters per track. The plot shows a GOOD and BAD example of a synthetic run for both pp and Pb-Pb collisions. The following messages can appear:
- Quality::GOOD
- Quality::Medium Mean is outside 5.2-6.2, ignore for COSMICS and TECHNICALS
- Quality::BAD: 0 tracks with 4/5/6/7 clusters (OK if it's synthetic run)
- Quality::BAD: NO ITS TRACKS
call the ITS on-call if a completely different plot is obtained, if the quality is BAD, or if the plot stays empty after 5 min of data taking.