MFT#
Quality summary#
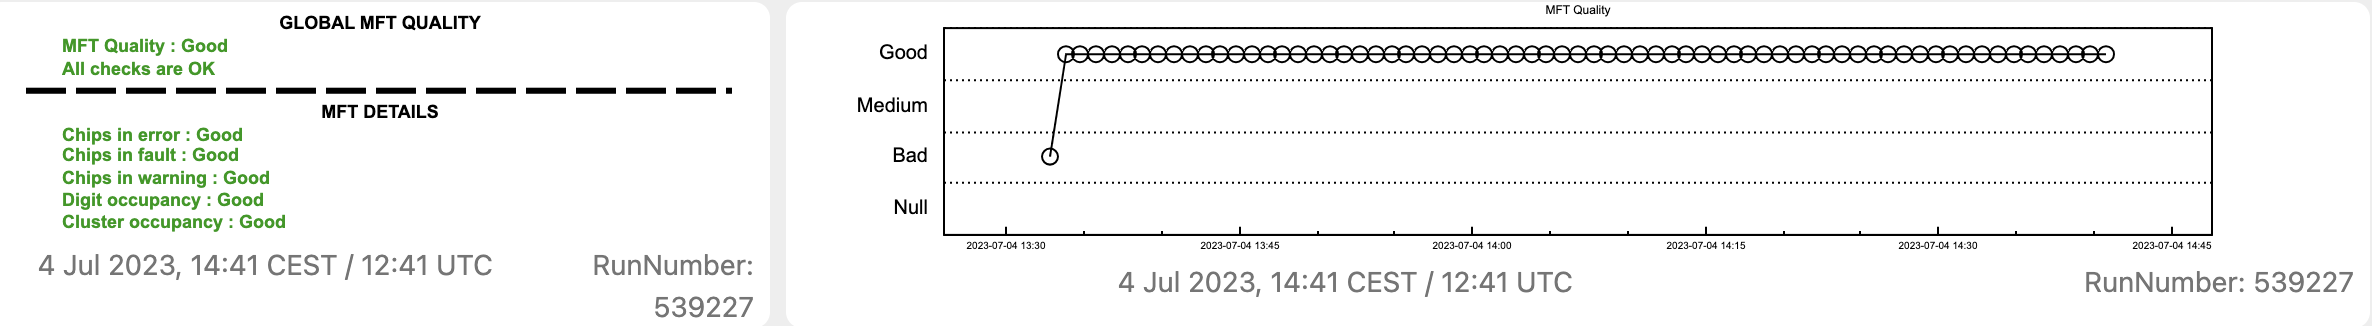
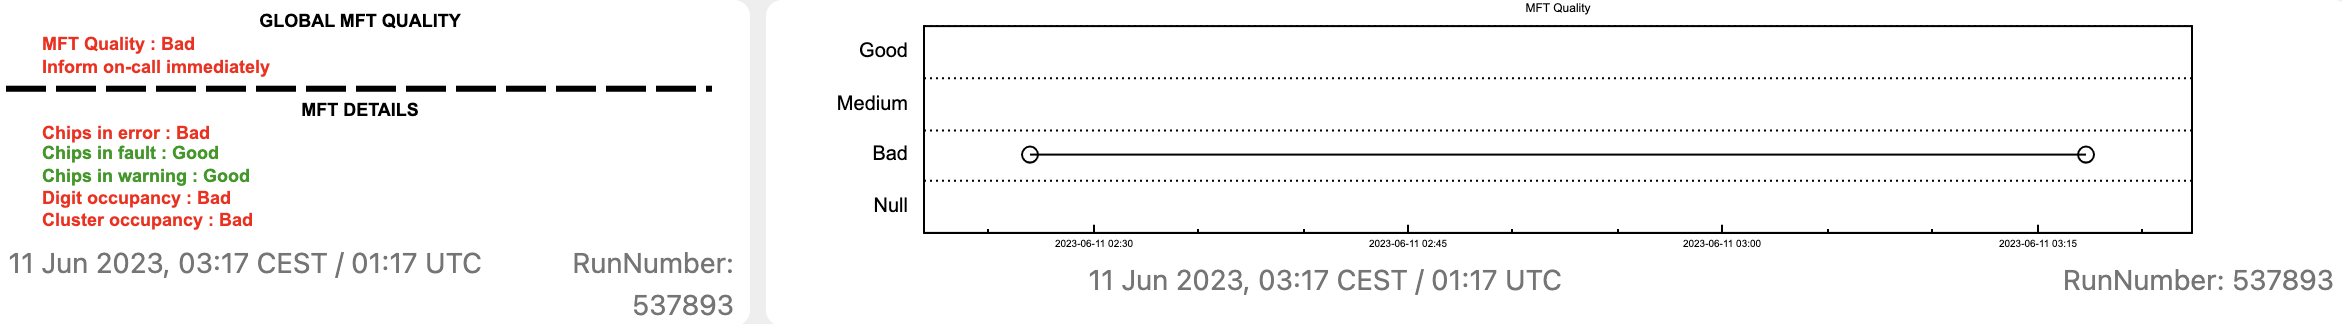
The left panel summarises all MFT QC checks for the last QC cycle. The top line gives aggregated quality status with the text message suggesting actions for the QC shifter. * Quality: BAD: contact MFT on-call expert * Quality: Medium: create a log entry * Quality: NULL: the plots are empty.
The bottom line shows an example of BAD status in Chips in error, Digit occupancy and Cluster occupancy plots.
The right panel provides a time trend of the MFT QC summary. If MFT quality is BAD for the whole run duration, MFT should be tagged as BAD in the logbook.
Chips in Error/Fault/Warning#
[QC on FLP - plot reset at each cycle]
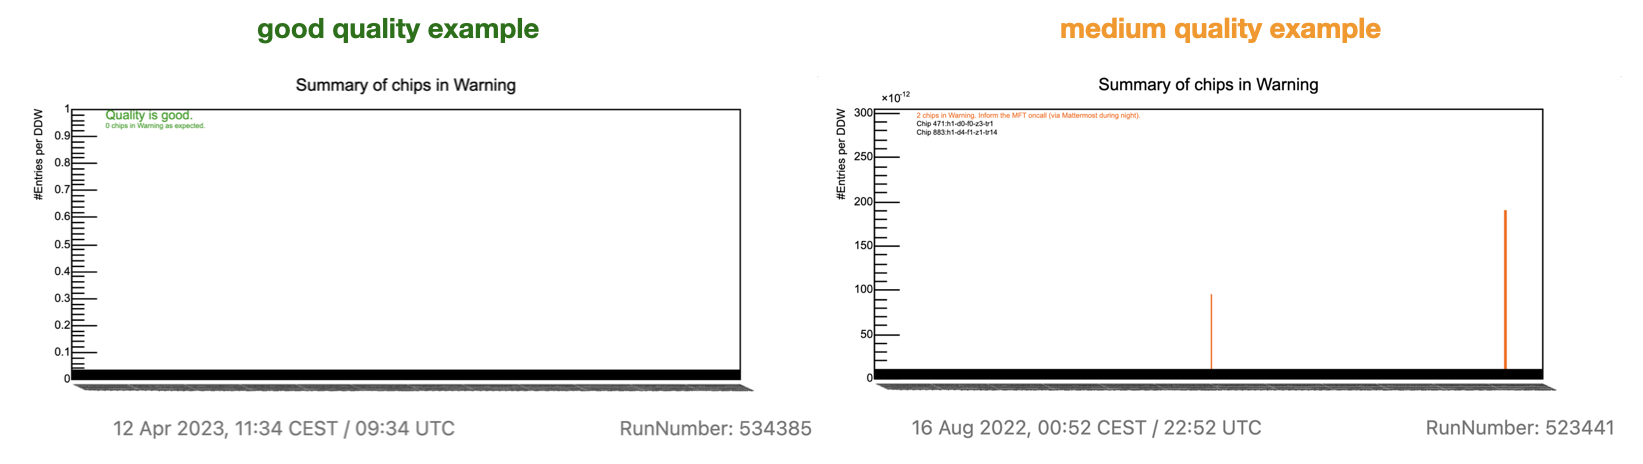
Plot description
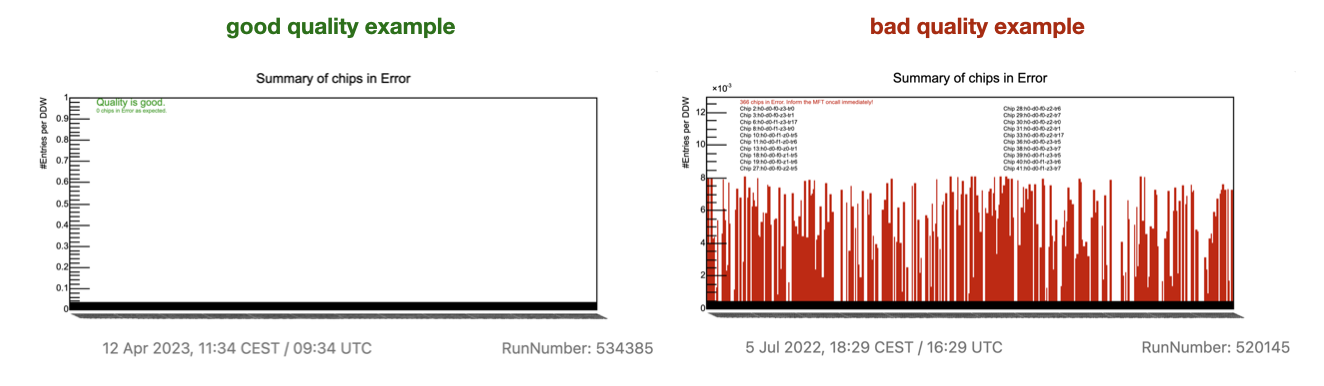
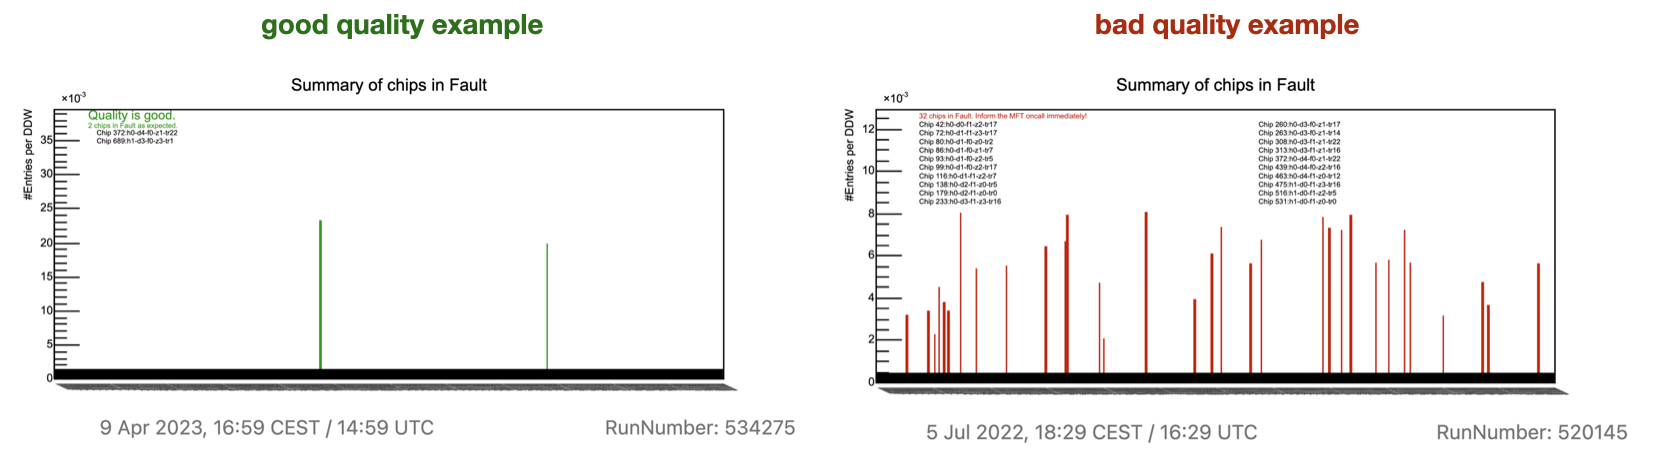
This plot is created on the FLPs. The histogram shows the number of MFT chips in Error/Fault/Warning and provides their list up to 20 entries.
Checks to be done
Check the message on the histogram.
Actions to be taken
Follow the instructions on the histogram message. Since MFT has auto-recovery of sensors implemented, call the on-call if the quality remains bad for more than 2 minutes.
Digit Occupancy Summary#
[QC on FLP - plot integrated over the run]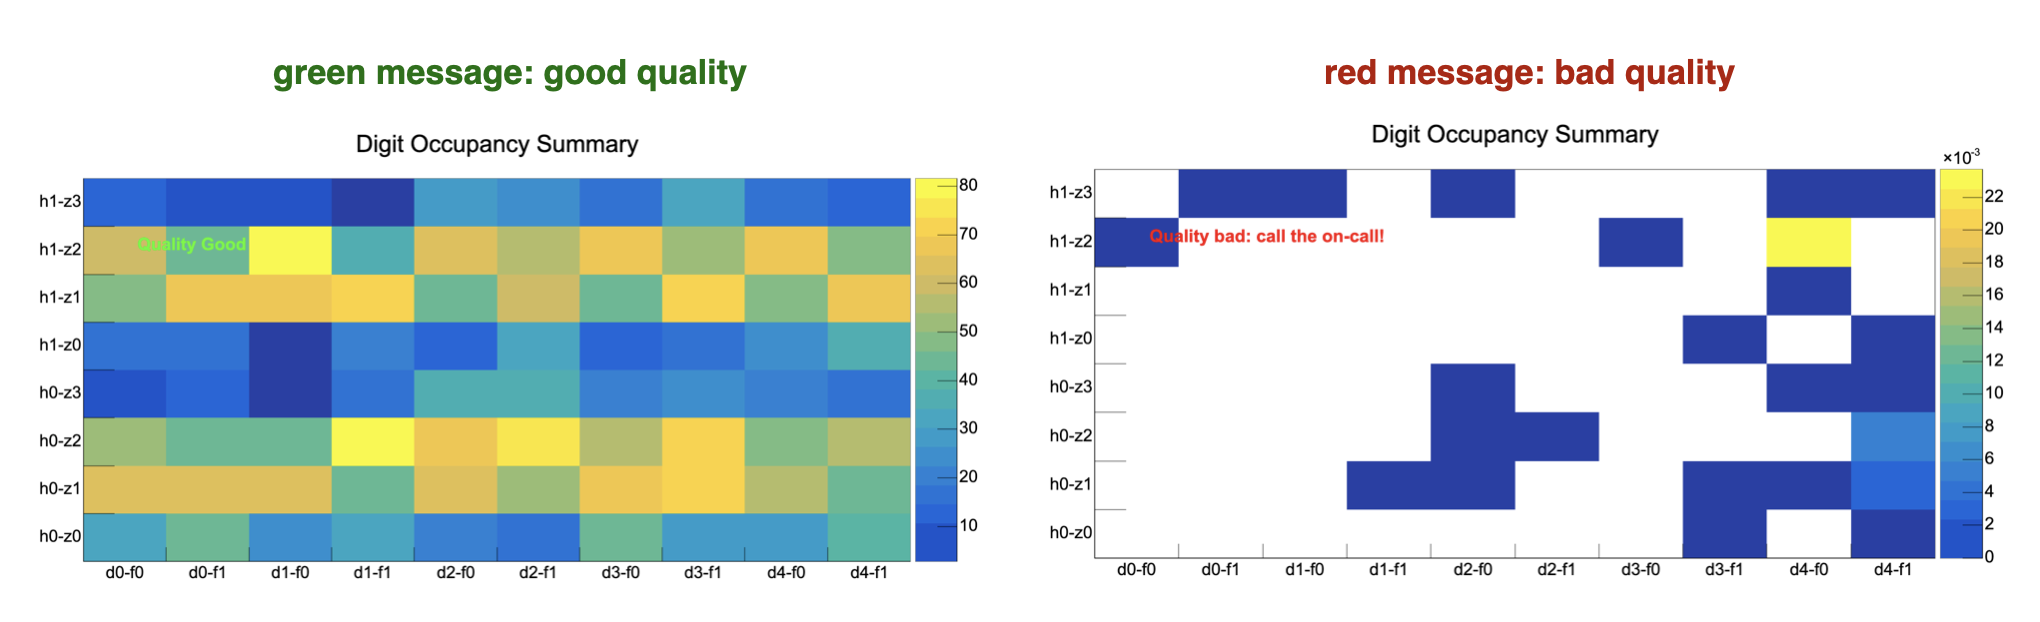
Plot description
This plot is created on the FLPs. The histogram shows the number of digits per ROF (Readout Frame) per MFT zone.
Checks to be done
There is an automatic checker for empty zones.
Actions to be taken
If several MFT zones are empty, the quality is bad (message in red), call the MFT on-call immediately.
Cluster Occupancy Summary#
[QC on EPN - plot integrated over the run]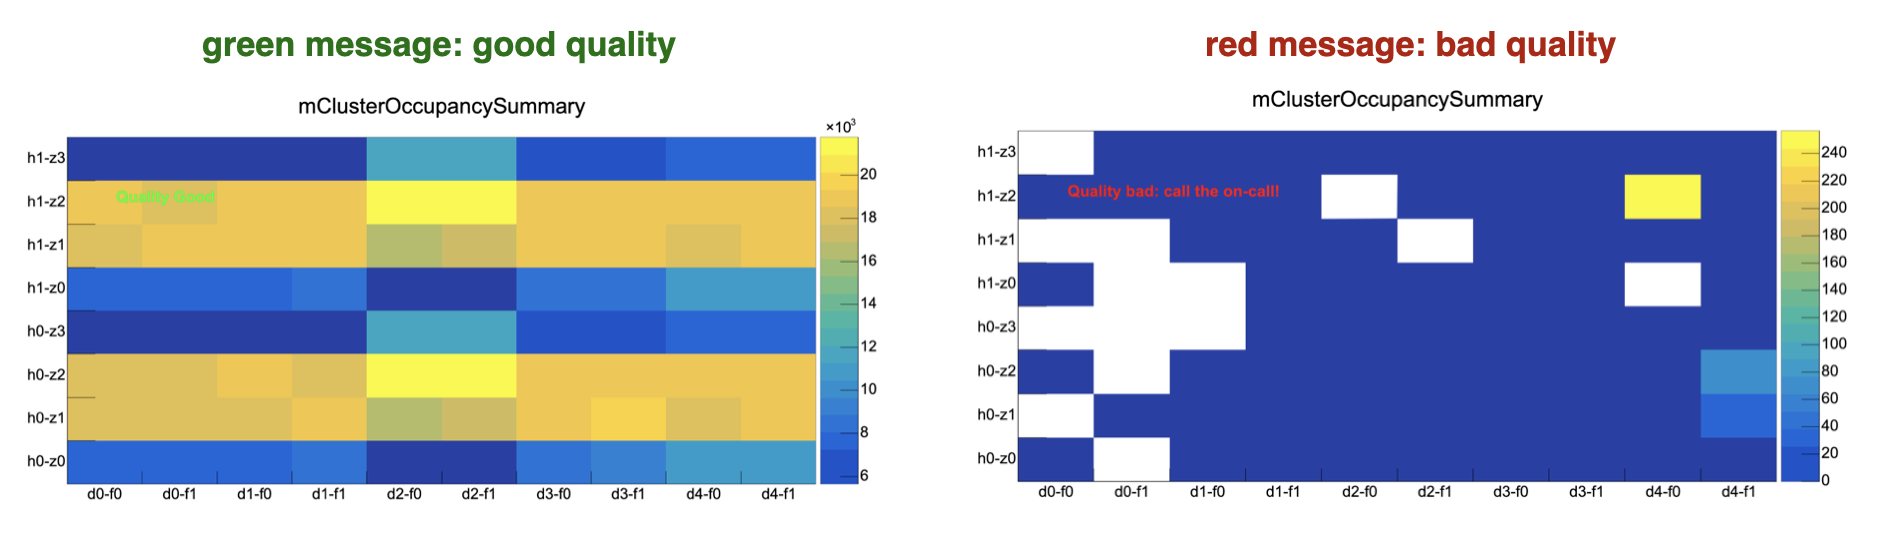
Plot description
This plot is created on the EPNs. The histogram shows the number of clusters per MFT zone.
Checks to be done
There is an automatic checker for empty zones.
Actions to be taken
If several MFT zones are empty, the quality is bad (message in red), call the MFT on-call immediately.
Distribution of the #clusters per ROF#
[QC on EPN - plot integrated over the run]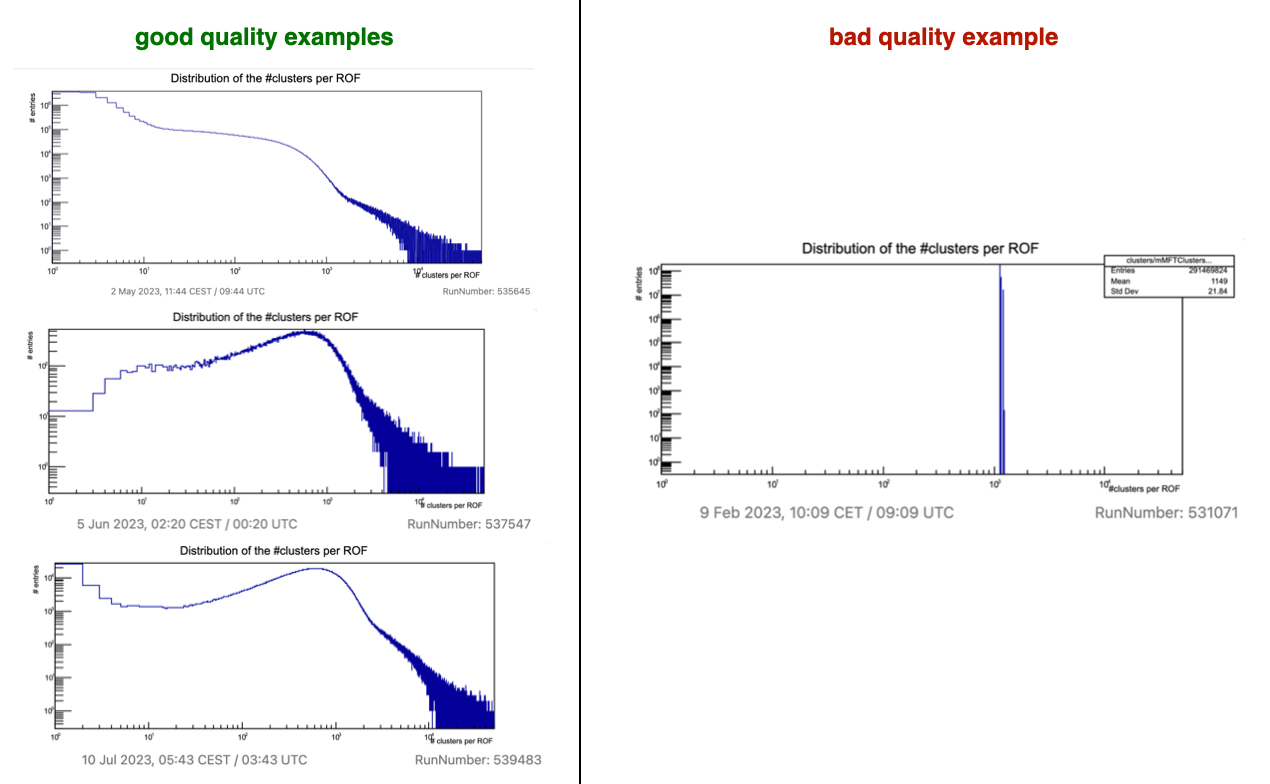
Plot description
This plot is created on the EPNs. The histogram shows the ROF size for clusters.
Checks to be done
The histogram should look similar to the good quality references (left) in this documentation.
Actions to be taken
If the plot looks significantly different from the good quality references call the MFT on-call.