Interaction Vertex Distributions#
Vertex distributions from matched central barrel tracks#
[QC on EPN]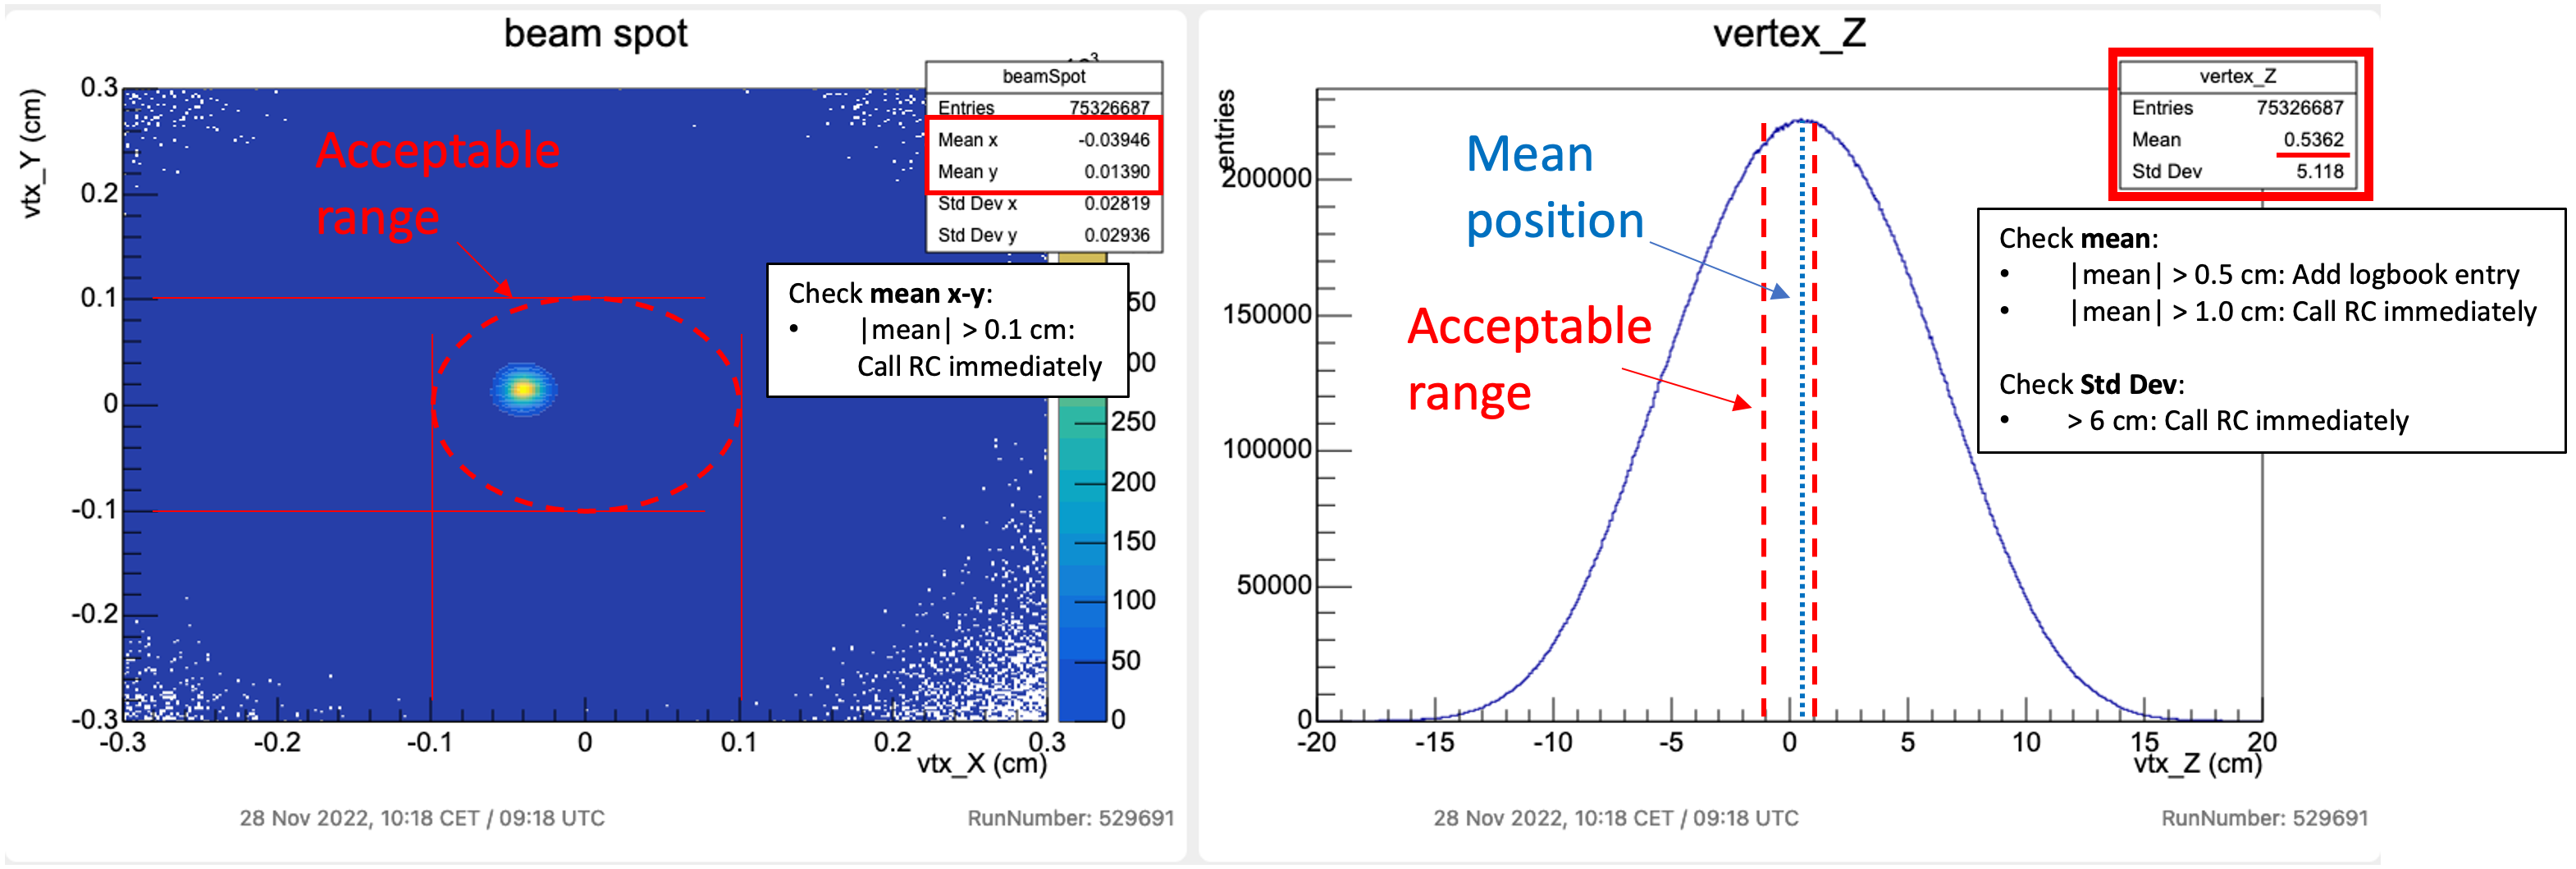
The left plot shows the transversal x-y distribution of the reconstructed vertices, while the right plot shows the longitudinal vertex distribution.
The mean value of the z vertes distribution usually fluctuates by +/- 0.3 cm around the central value. The mean values in the x-y directions are usually very stable.
The RM/RC must be informed immediately if:
- the mean x and y values are outside [-0.1 cm, +0.1 cm]
- the mean z value is outside [-1.0 cm, +1.0 cm]
- the standard deviation in z is larger than 6.0 cm
A bookkeeping entry tagging RC should be added if the mean z value is outside [-0.5 cm, +0.5 cm].