- CPV
- EMC
- [QC on FLP] Error Type for SM (Super Module)
- [QC on FLP] Payload Size/events
- [QC on FLP] FECidMaxChWithInput_perSM
- [QC on FLP] Bunch minimum amplitude EMCAL+DCAL
- [QC on EPN] Cell Occupancy plots (PHYS) for E>0.2 GeV and E<0.2 GeV and Cell Occupancy plots (CALIB) for E>0.5 GeV
- [QC on EPN] Cell Amplitude
- [QC on EPN] Cell Time
- Number of triggers per Time Frame
- Known issues
- FDD
- FT0
- FV0
- HMP
- ITS
- ITS KNOWN ISSUES
- MCH
- MID
- PHS
- TOF
- TPC
- TRD
- ZDC
CPV#
Technical runs#
If you see "Number of entries has not changed in the past cycle" but run is still ongoing then most probable reason is that PHS bacome busy. You can check with ECS shifter and inform the on-call if he is not informed yet. If PHS is not busy but you see this message then inform the on-call.
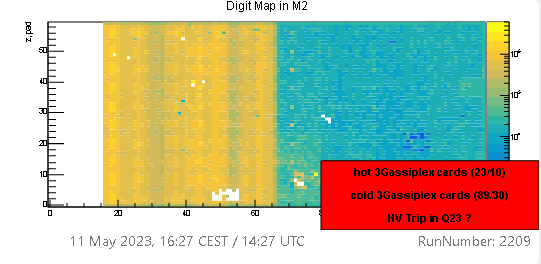
Message "Cold (hot) 3G cards (N/X)" is tolerated if plots look like reference.
Good plots:
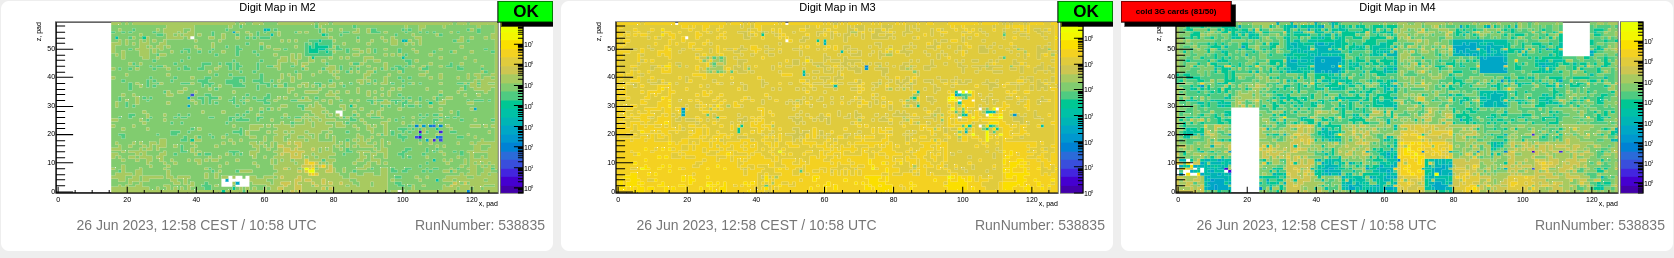
The plots represent number of digits seen in each channel. It should be more or less populated. In case when it is very different from reference please inform CPV on-call.
[QC on EPN] Error occurance#
Good plot:
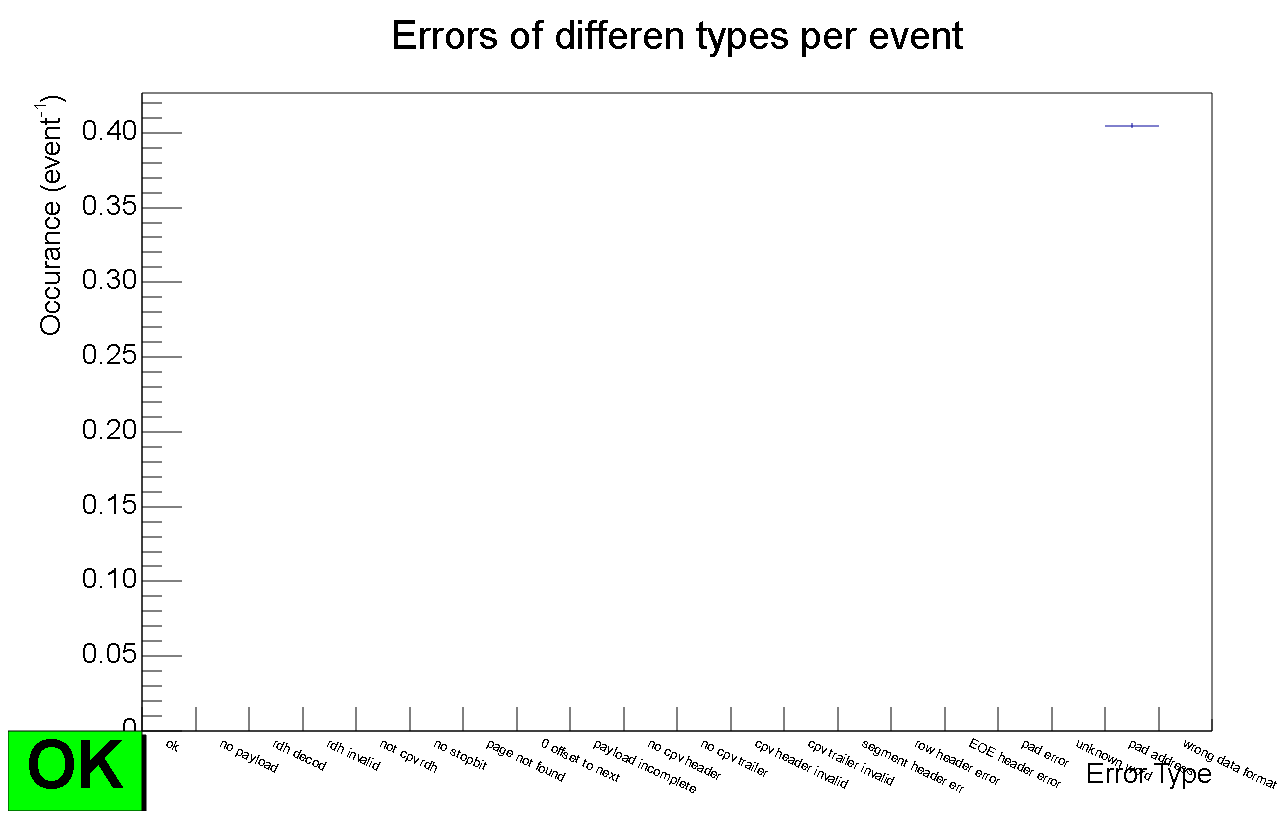
If plot is not OK then put a log entry and call the oncall during morning and afternoon shift. No need to call at night if there are no other issues. No need to put bad flag for run if there are no other issues.
Minimal duration after SOR before taking any action required by these instructions: 10 min
Known issues#
-
In PEDESTAL runs QC plot "Pedestal sigma distribution M3 is bad". Acording to expert, noise conditions in CPV depend on general environment in ALICE, therefore, from time to time CPV pedestals can become wider which is reflected in QC-CPV calibration run plot with the message "Number of bad pedestal sigmas in module M3 (sometimes in M2) is larger than the upper limit". This is a known issue, can be ignored, but make a log entry when it happens. See: https://ali-bookkeeping.cern.ch/?page=log-detail&id=45015
-
In PHYSICS runs Red messages on QC Plot "Digit Map in M4". Problem with high voltage is preventing this module from running normally. Experts are trying to recover. No need to report. Run quality must be setted to "good" if there are no problems with other modules. See: https://ali-bookkeeping.cern.ch/?page=log-detail&id=53523. Quality aggregator is also expected to show bad quality for
Digit oocupancy checkandCalibDigit amplitude check.
EMC#
Don't call EMC expert during the night if run is not physics
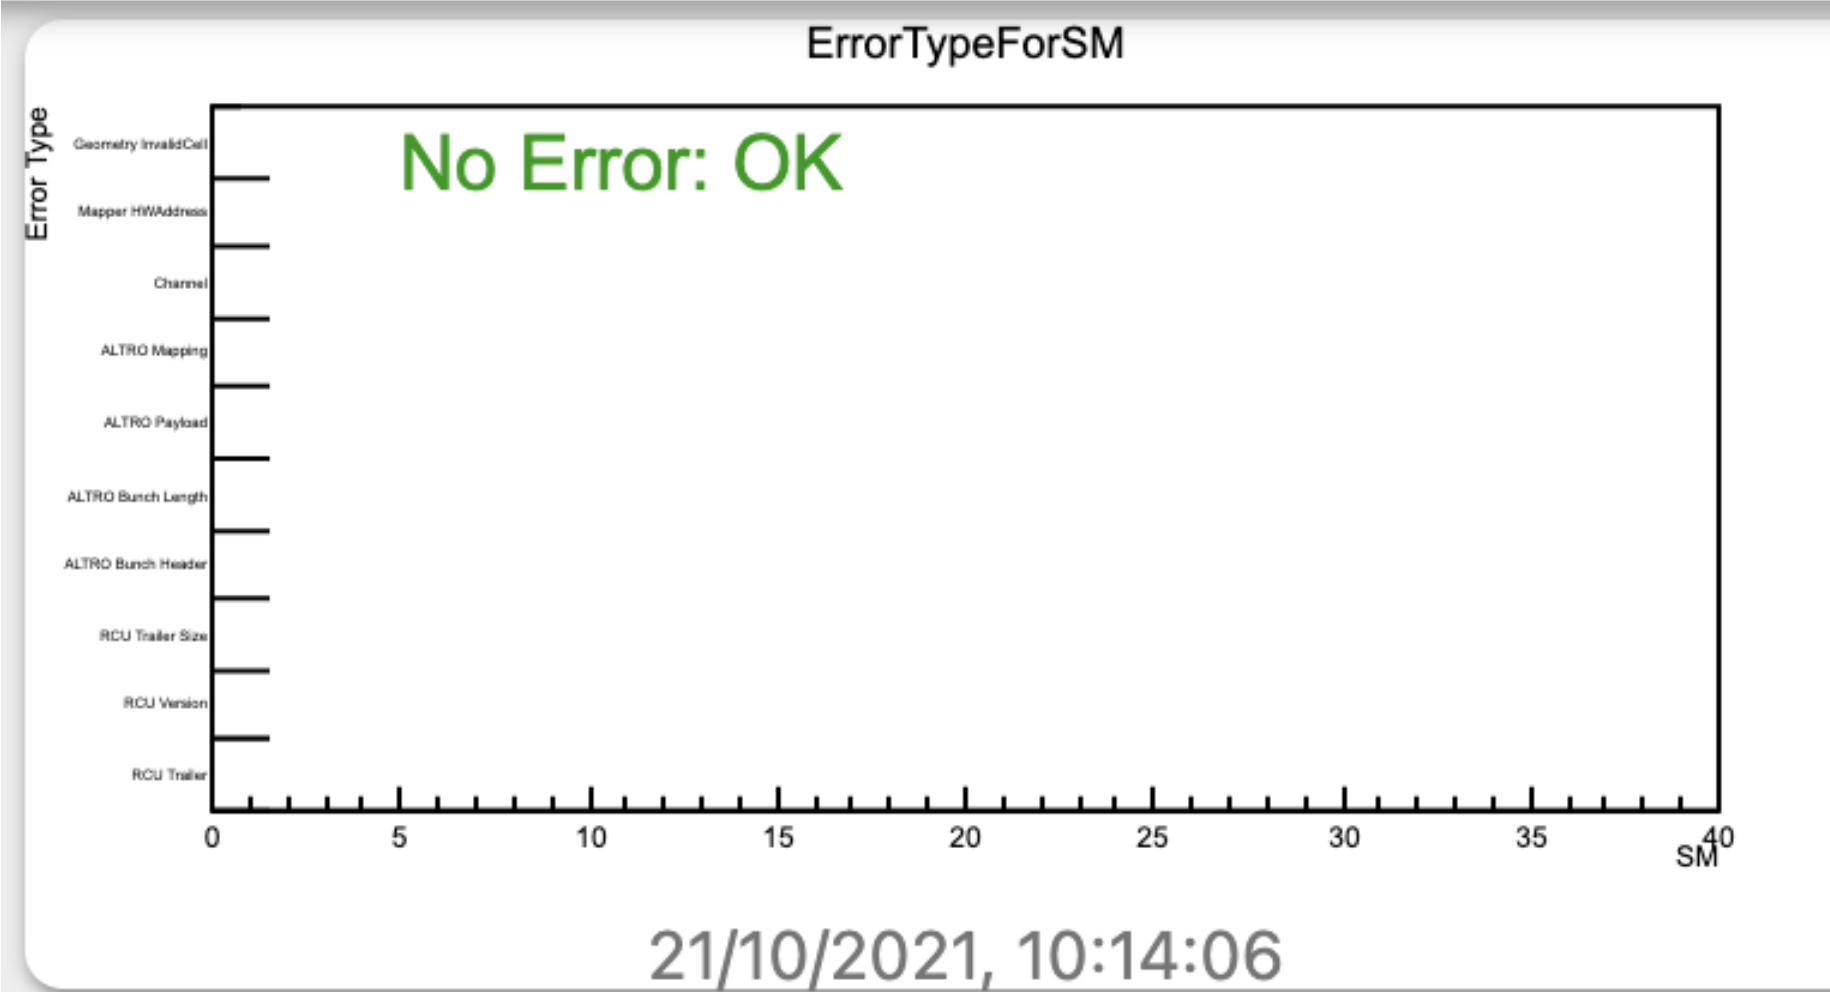
[QC on FLP] Error Type for SM (Super Module)#
| Green: good quality | Red: bad quality |
|---|---|
 |
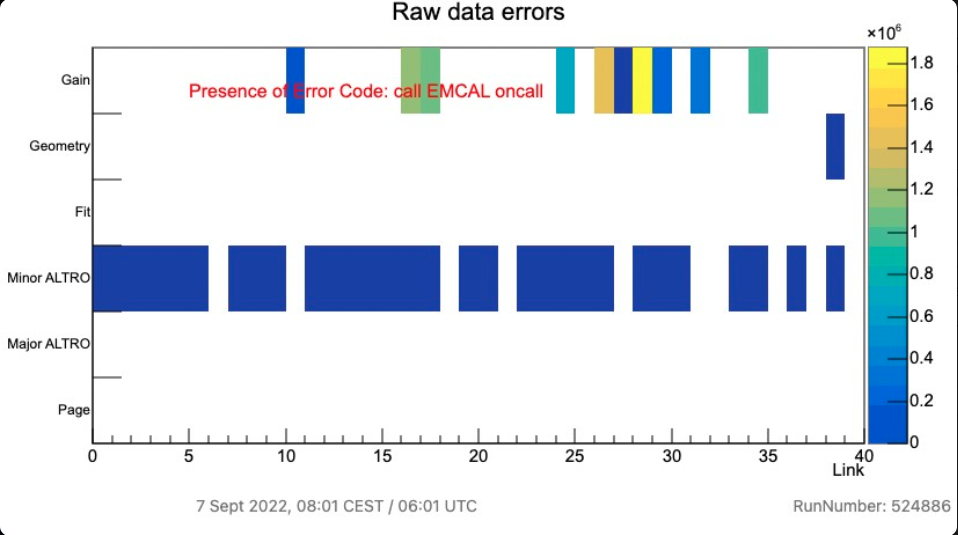 |
- If no entries, a green message "No Error: OK" inform you that everything is working properly.
- In case of errors, a red message will appear: EMCAL oncall should be informed if EMCAL is in global runs and if it is not during night shift. Take note of the error-type in the y axis.
- If the errors appear during nigh shift:
- add a note in the logbook, don't call the on-call.
- in case LHC is preparing for collisions the on-call should be notified at "Prepare Ramp" (even during the night in this case) in case of such errors occur in a technical run before, so that the cards can be recovered before taking physics data.
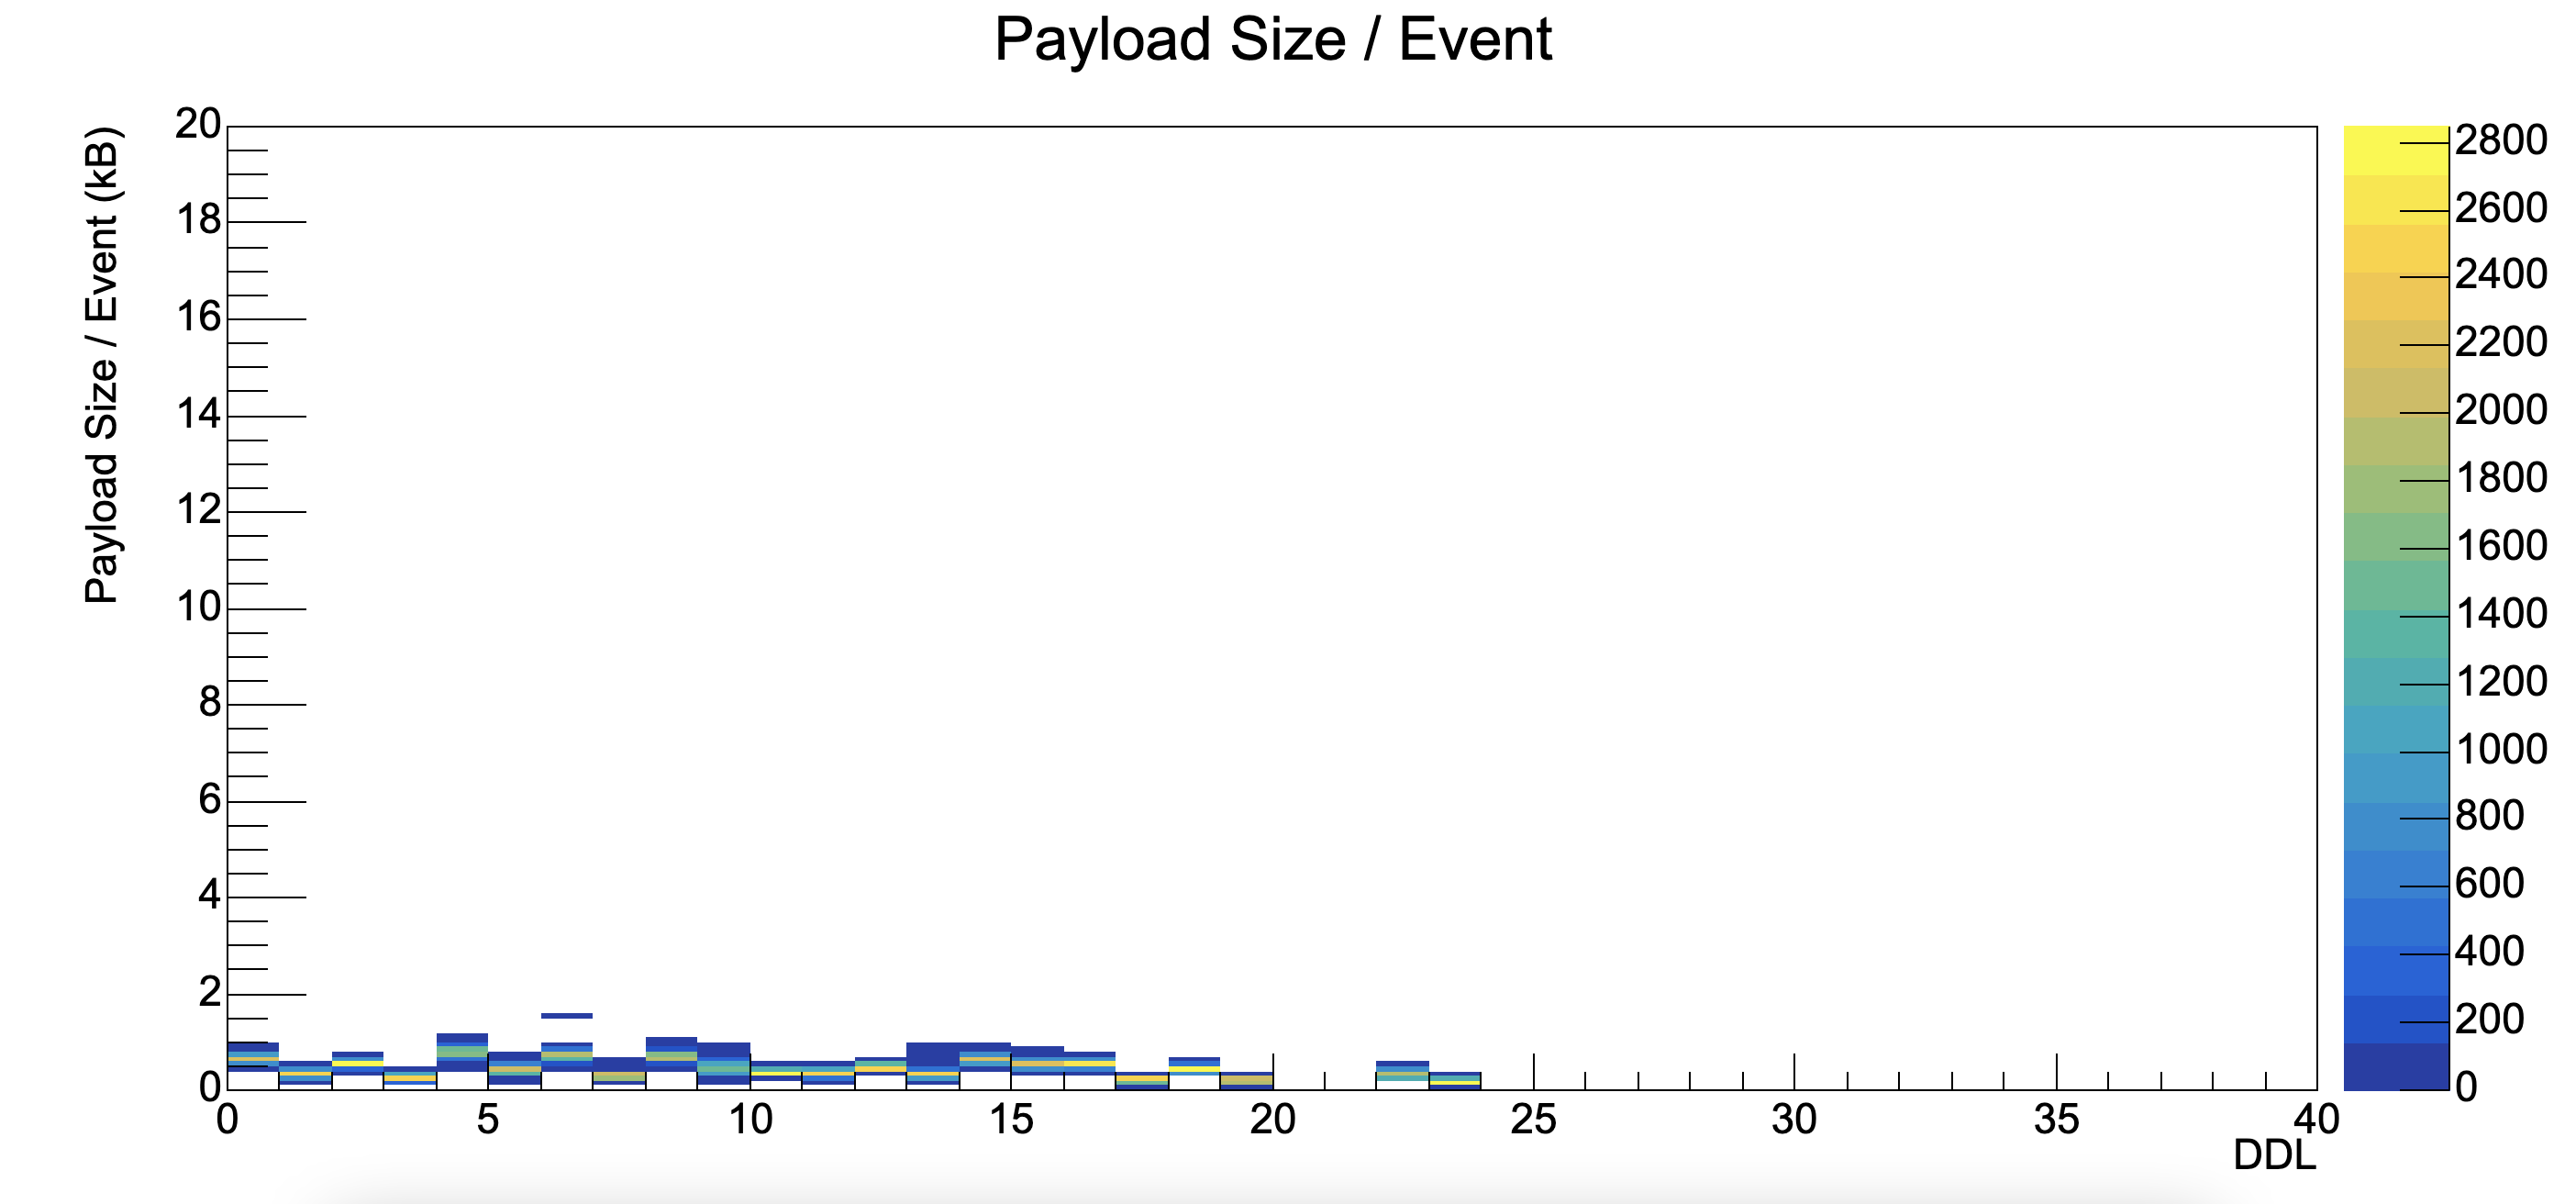
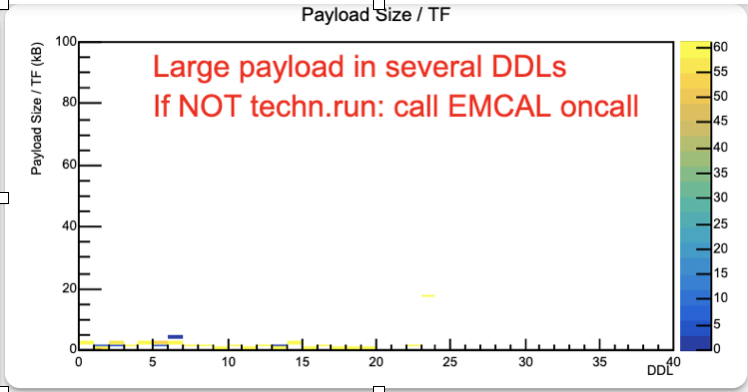
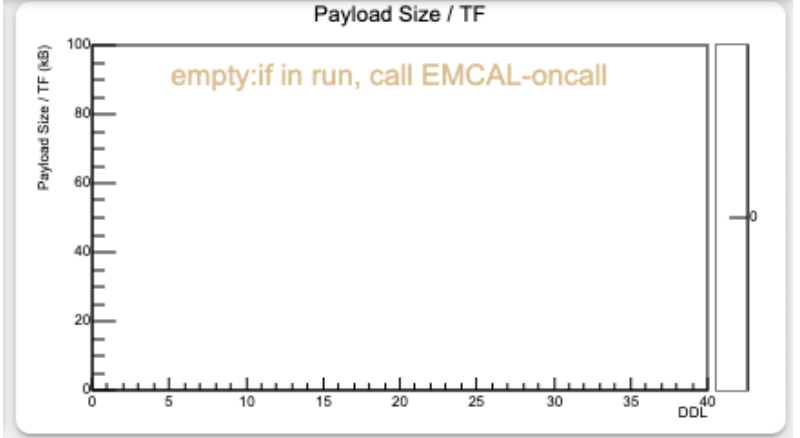
[QC on FLP] Payload Size/events#
| good quality | bad quality | empty |
|---|---|---|
 |
 |
 |
- If "Data OK" is shown, everything is fine.
- If some of the DDL presents entries that are larger than the others, a red message will appears: please call EMCAL oncall.
- If the plot is empty, and EMCAL is included in the data taking, call EMCAL oncall.
[QC on FLP] FECidMaxChWithInput_perSM#
| bad quality | empty |
|---|---|
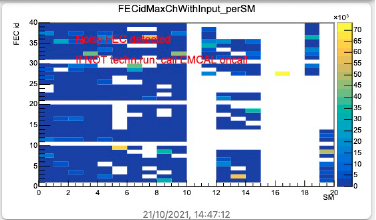 |
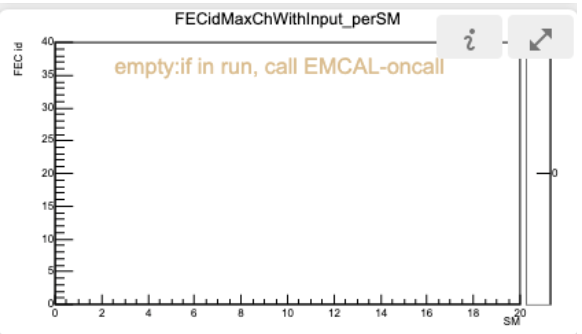 |
- If "Data OK" is shown, everything is fine.
- If a FEC is noisy (not uniform distributions) please call the EMCAL oncall.
- Ignore the red messages: they are not yet tuned for data.
- If the plot is empty, and EMCAL is included in the data taking, call EMCAL oncall.
[QC on FLP] Bunch minimum amplitude EMCAL+DCAL#
| good quality | bad quality |
|---|---|
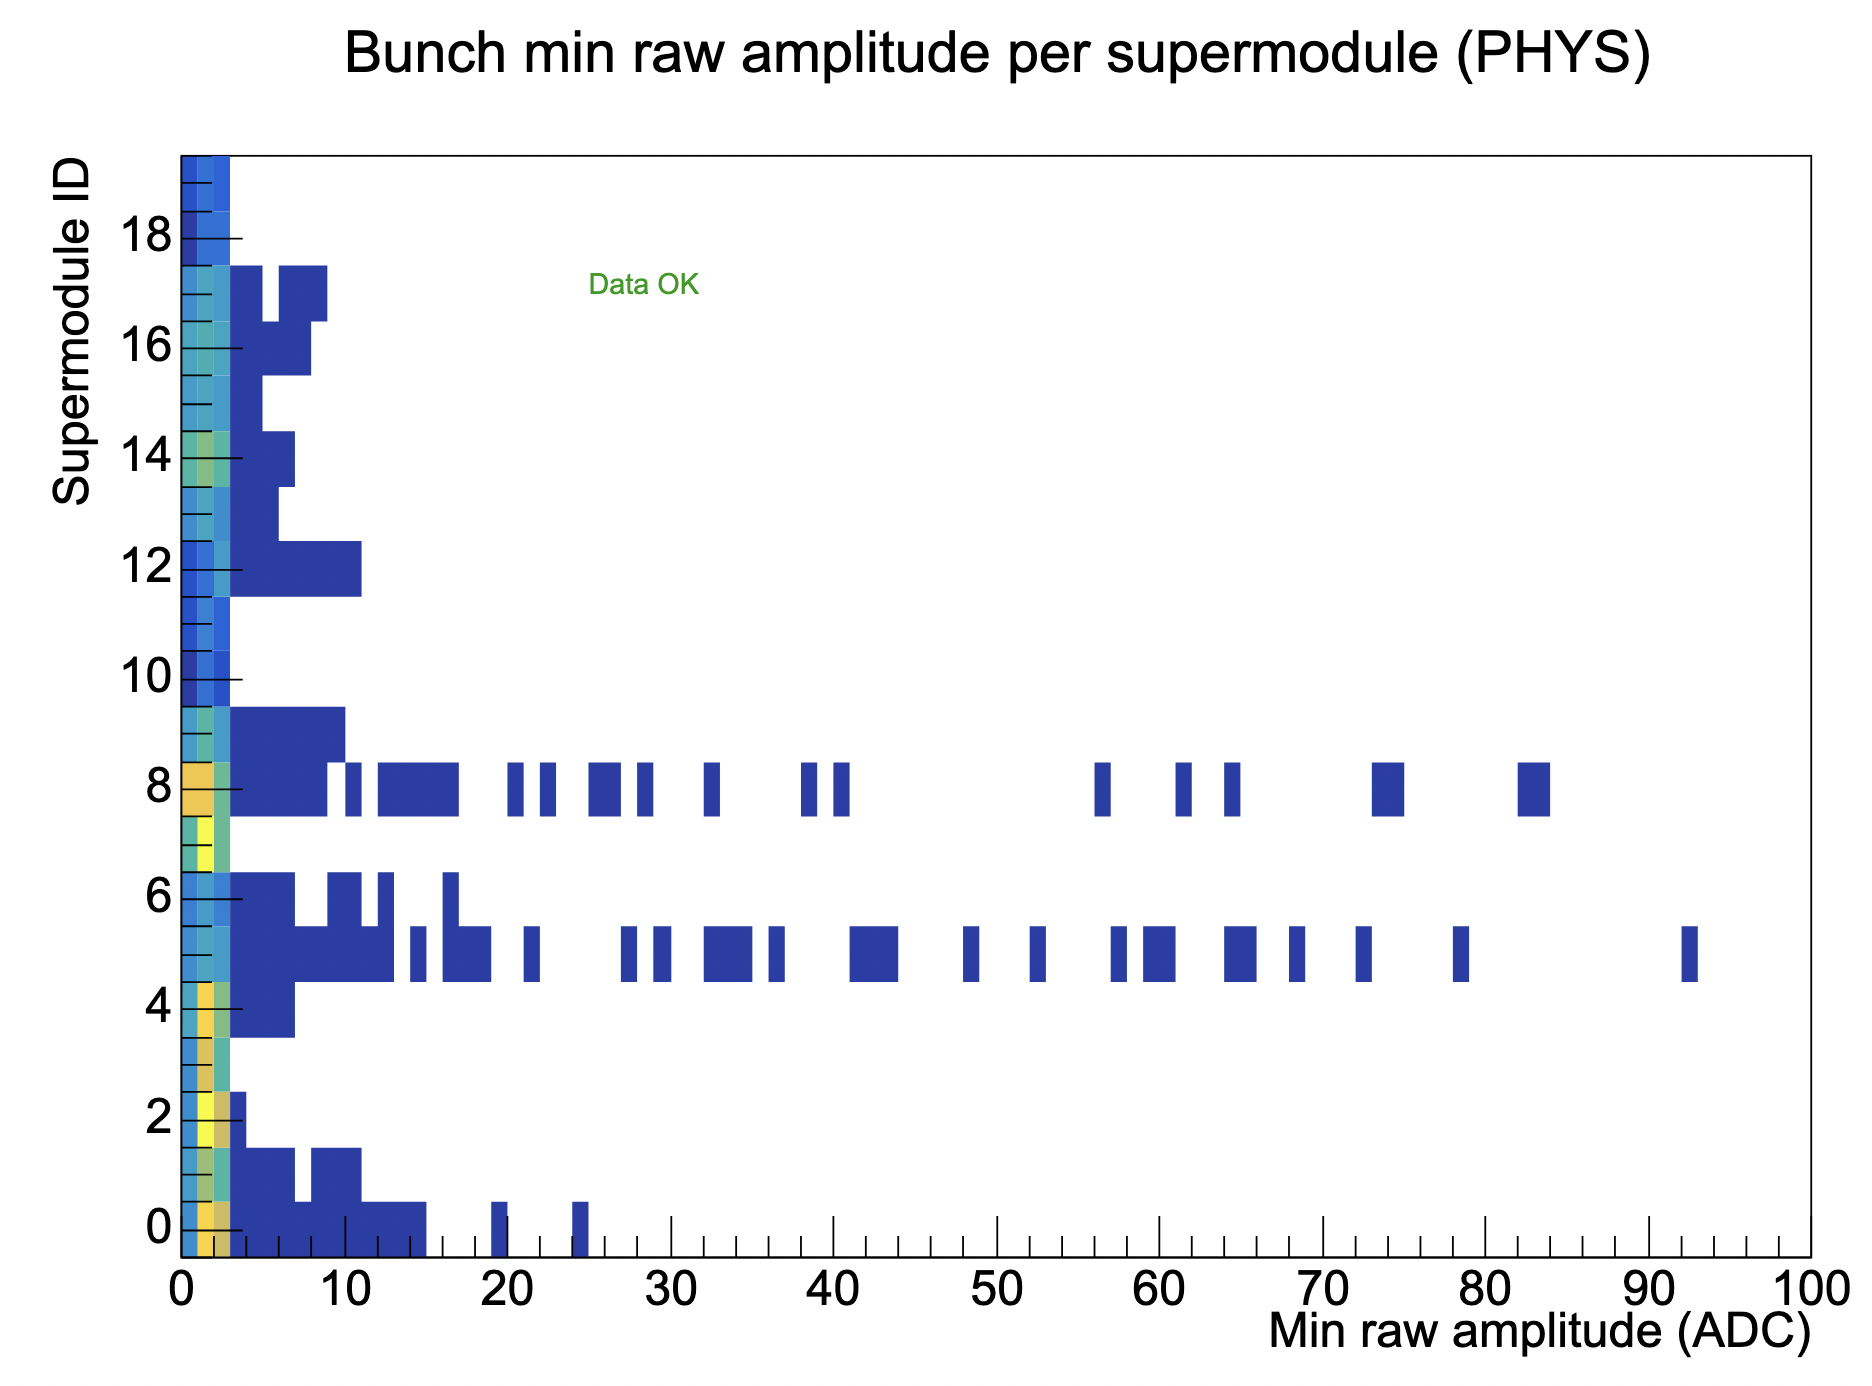 |
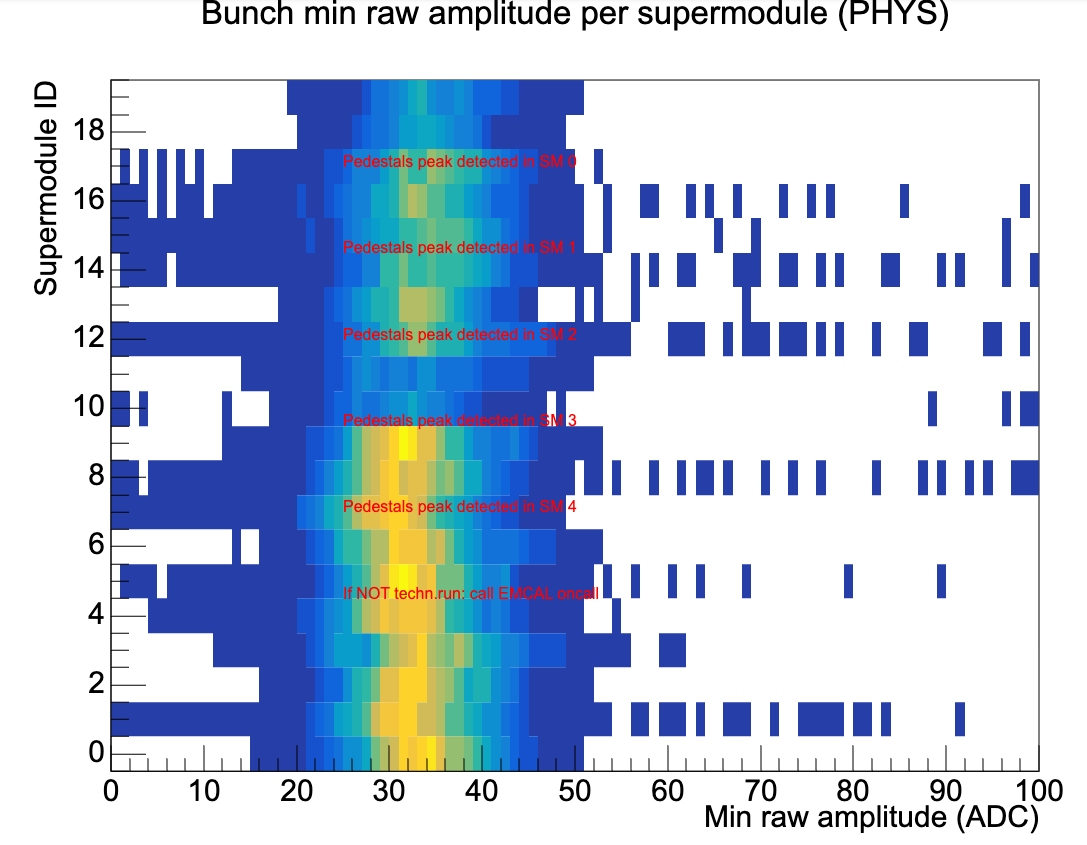 |
- One peak should be visibile for all supermodules around 0 if EMCAL is in data taking.
- If the peak moves to the range 20-50 "Min raw amplitude (ADC)" for any supermodule, or a second peak appears for any supermodule in that range , call EMCAL oncall
- If the plot is empty, and EMCAL is included in the data taking: please call EMCAL oncall
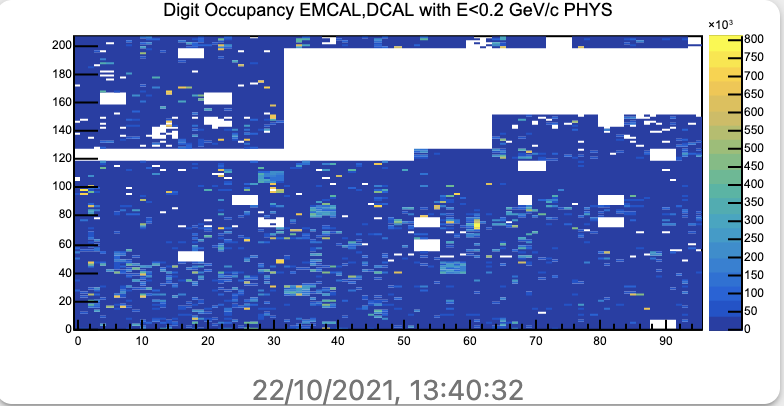
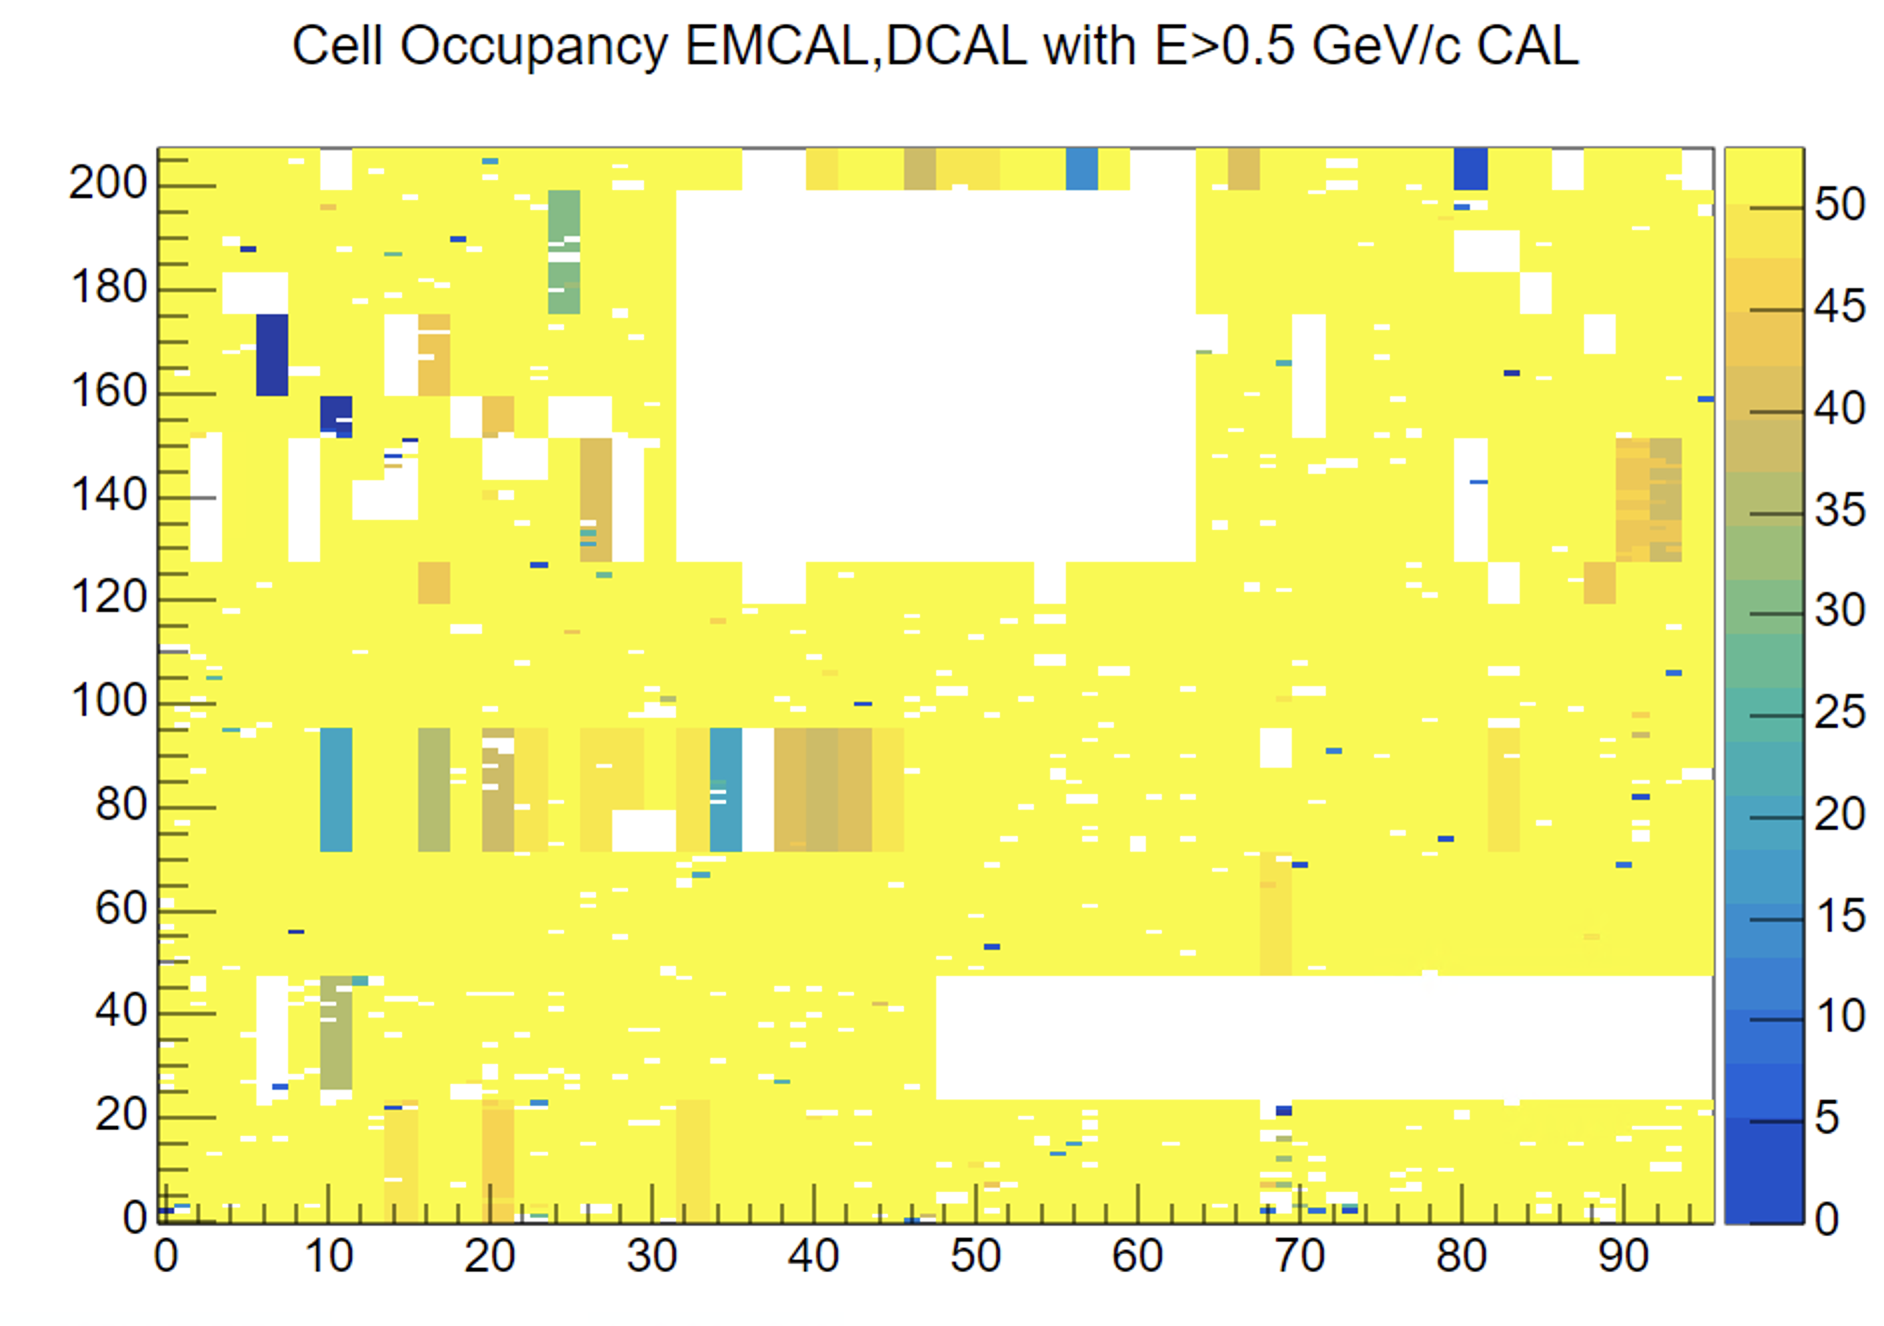
[QC on EPN] Cell Occupancy plots (PHYS) for E>0.2 GeV and E<0.2 GeV and Cell Occupancy plots (CALIB) for E>0.5 GeV#
| good quality | good quality | bad quaity |
|---|---|---|
 |
 |
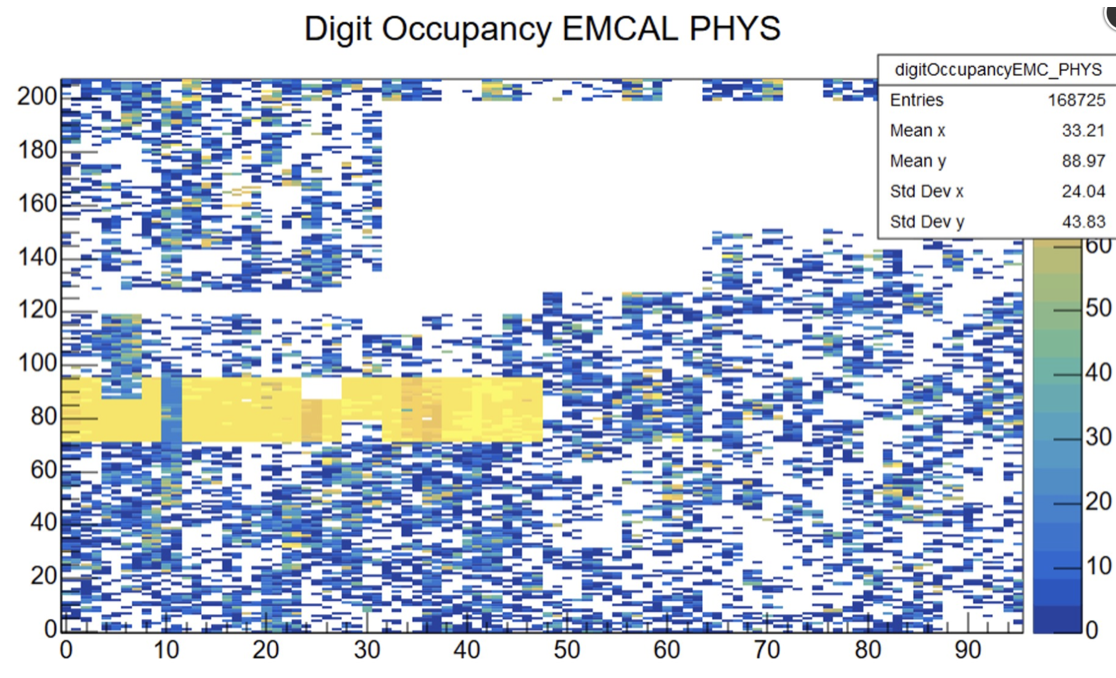 |
IF PHYSICS RUN
- The occupancy plots should be uniformly filled during Physics runs.
- if something noisy appears, please call the EMCAL oncall.
- If the plot is empty, and EMCAL is included in the data taking, call EMCAL oncall.
IF CALIBRATION RUN monitor: Digit Occupancy plots (CALIB) for E>0.5 GeV
- it should be uniformly filled during Calibration runs.
- if something noisy appears, please call EMCAL oncall.
[QC on EPN] Cell Amplitude#
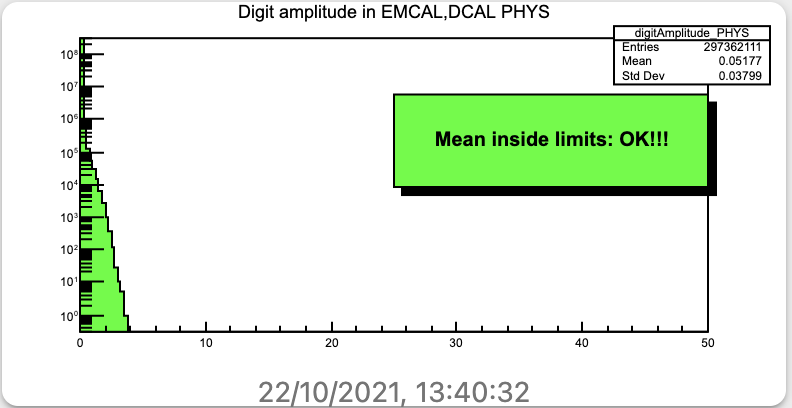
- no instructions for the moment.
- If the plot is empty, and EMCAL is included in the data taking, call EMCAL oncall.
[QC on EPN] Cell Time#
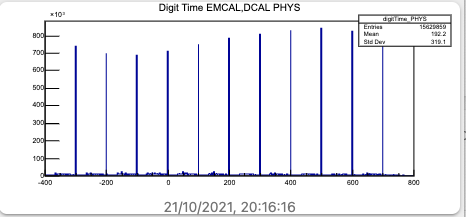
- If the plot is empty, and EMCAL is included in the data taking, call EMCAL oncall.
- If the errors appear during nigh shift:
- add a note in the logbook, don't call the on-call.
- in case LHC is preparing for collisions the on-call should be notified at "Prepare Ramp" (even during the night in this case) in case of such errors occur in a technical run before, so that the cards can be recovered before taking physics data.
Number of triggers per Time Frame#
| good quality | bad quality |
|---|---|
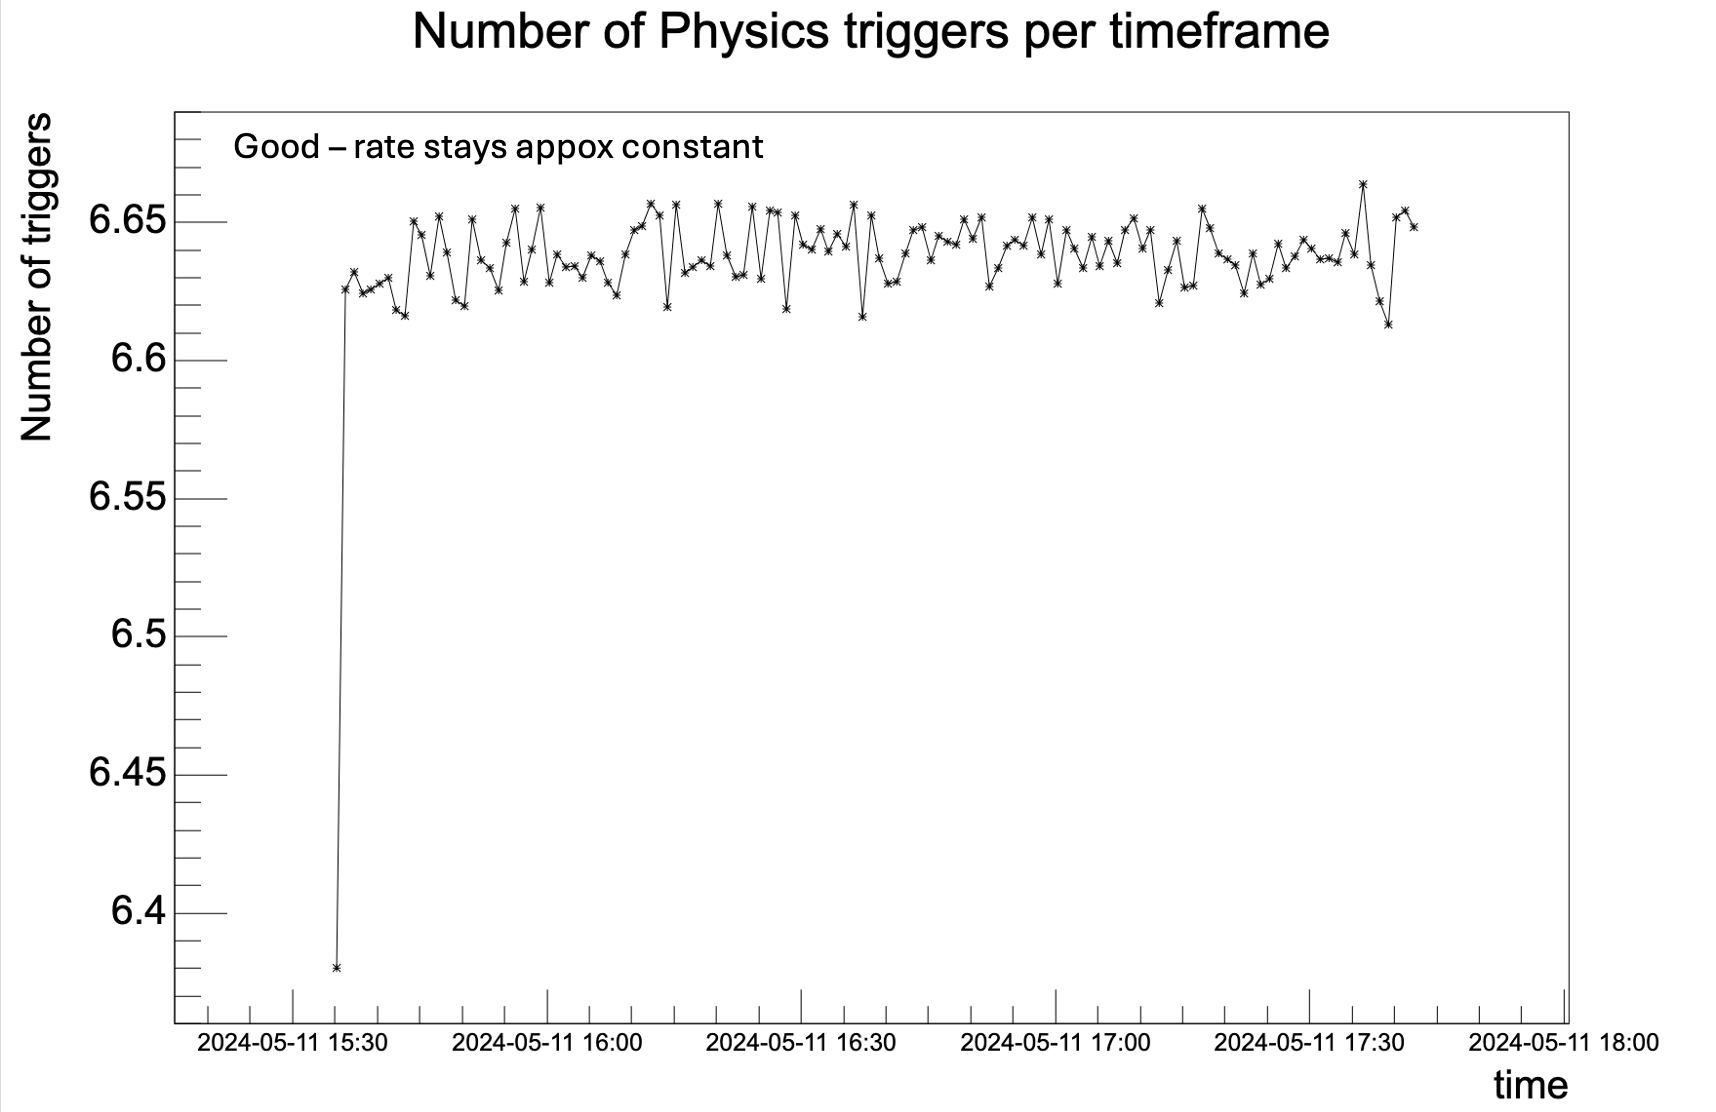 |
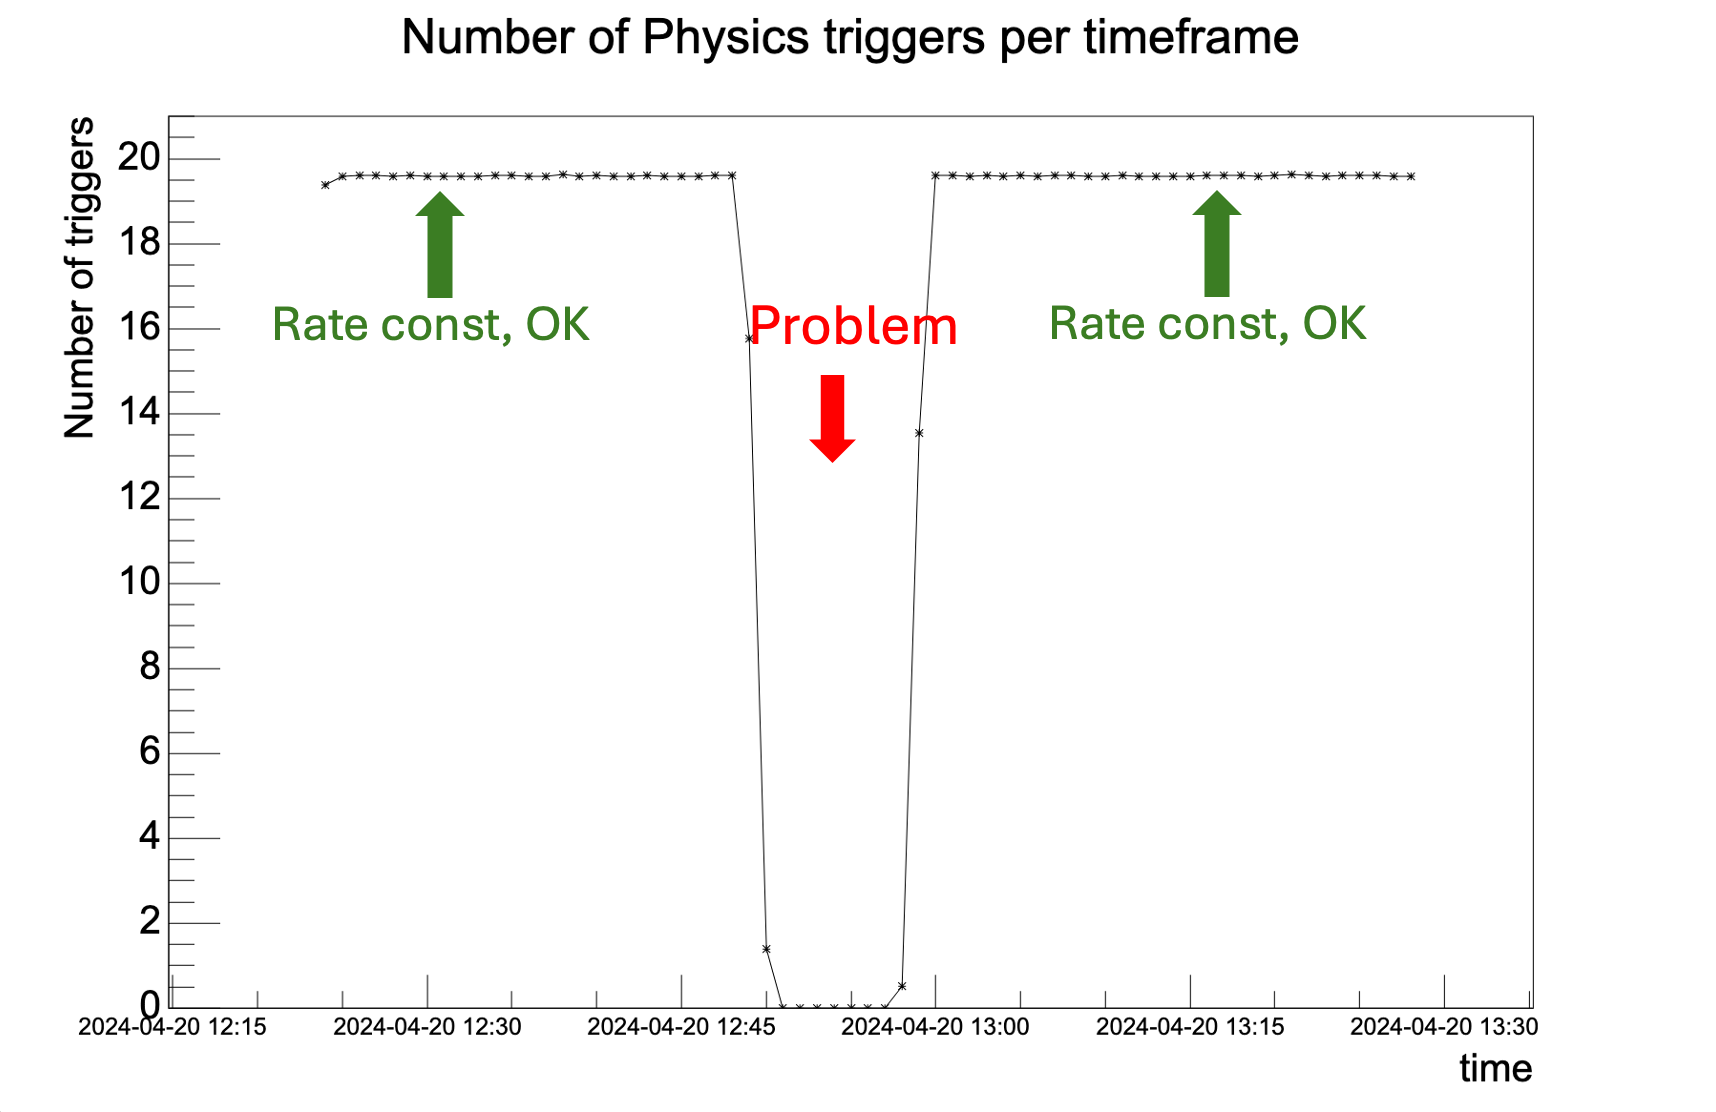 |
| Trigger rate appox. const with minor fluctuations | Trigger rate dropping by several events / timeframe or to almost 0 |
The number of triggers per Time Frame must stay constant while the run is ongoing. In case the number of trigger decreases call the EMCAL on-call (for technical and cosmics runs not during the night). The correct value will depend on the interaction rate and a checker will be implemented soon; for the moment please inform the oncall on case of changes during the run.
Known issues#
-
Do not call EMC oncall during the night for QC plots related errors for non PHYSICS runs, unless a PHYSICS run is expected next.
-
An empty region is expected near the bottom-right corner for CAL (Calibration) triggers.
FDD#
In the global TECHNICAL runs the FDD HV is set to 0 V. Zero counts is expected.
No online QC is provided.
Actions:
- None.
Known issues#
- The Out of bunch collisions plot can be ignored in SYNTHETIC runs at the moment (i.e. no need to take any actions in case of not GOOD quality). The BC distribution is not simulated properly in MC and will always cause problems in this plot.
FT0#
In the global TECHNICAL runs the FT0 HV is set to 0 V. Zero counts is expected.
No online QC is provided.
Actions:
- None.
Known issues#
- channels 60-63 (FT0A side) are OFF in PHYSICS and COSMICS runs
- channels 139 and 176-179 (FT0C side) are OFF in PHYSICS and COSMICS runs
FV0#
In the global TECHNICAL runs the FV0 HV is set to 0 V. Zero counts is expected.
No online QC is provided.
Actions:
- None.
Known issues#
HMP#
Busy time#
[QC on FLP]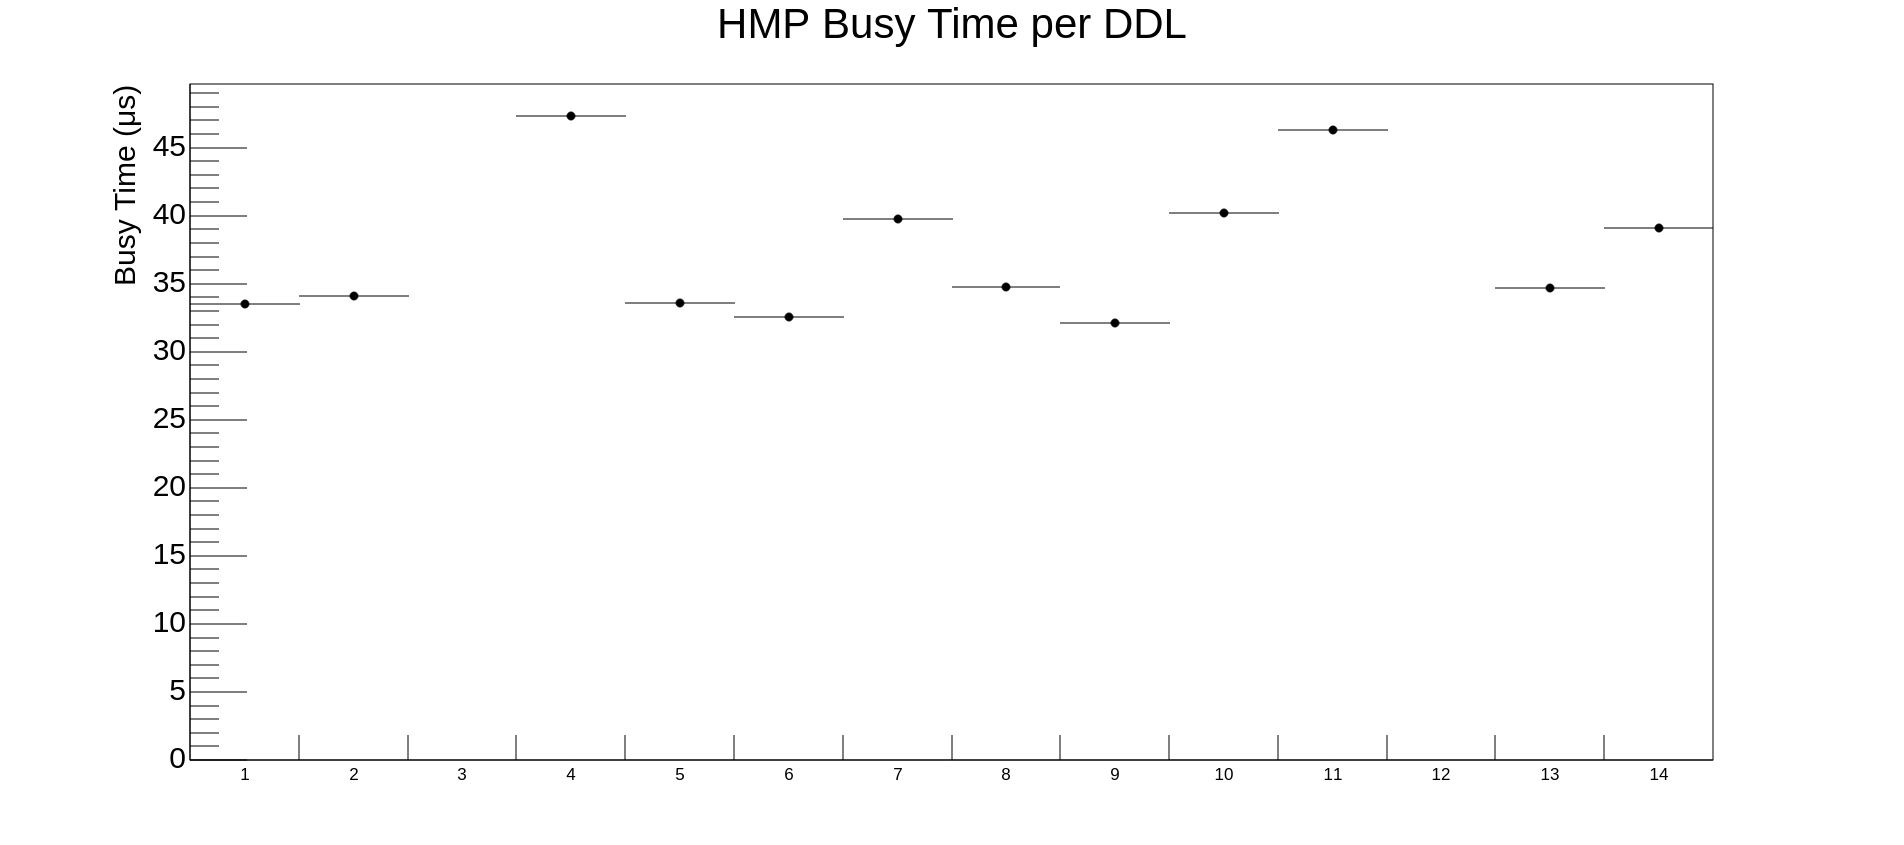
The plot shows the busy time of the detector. In case more than three equipments exceeds 120 microsec or the plot is empty call HMP on-call
Event size#
[QC on FLP]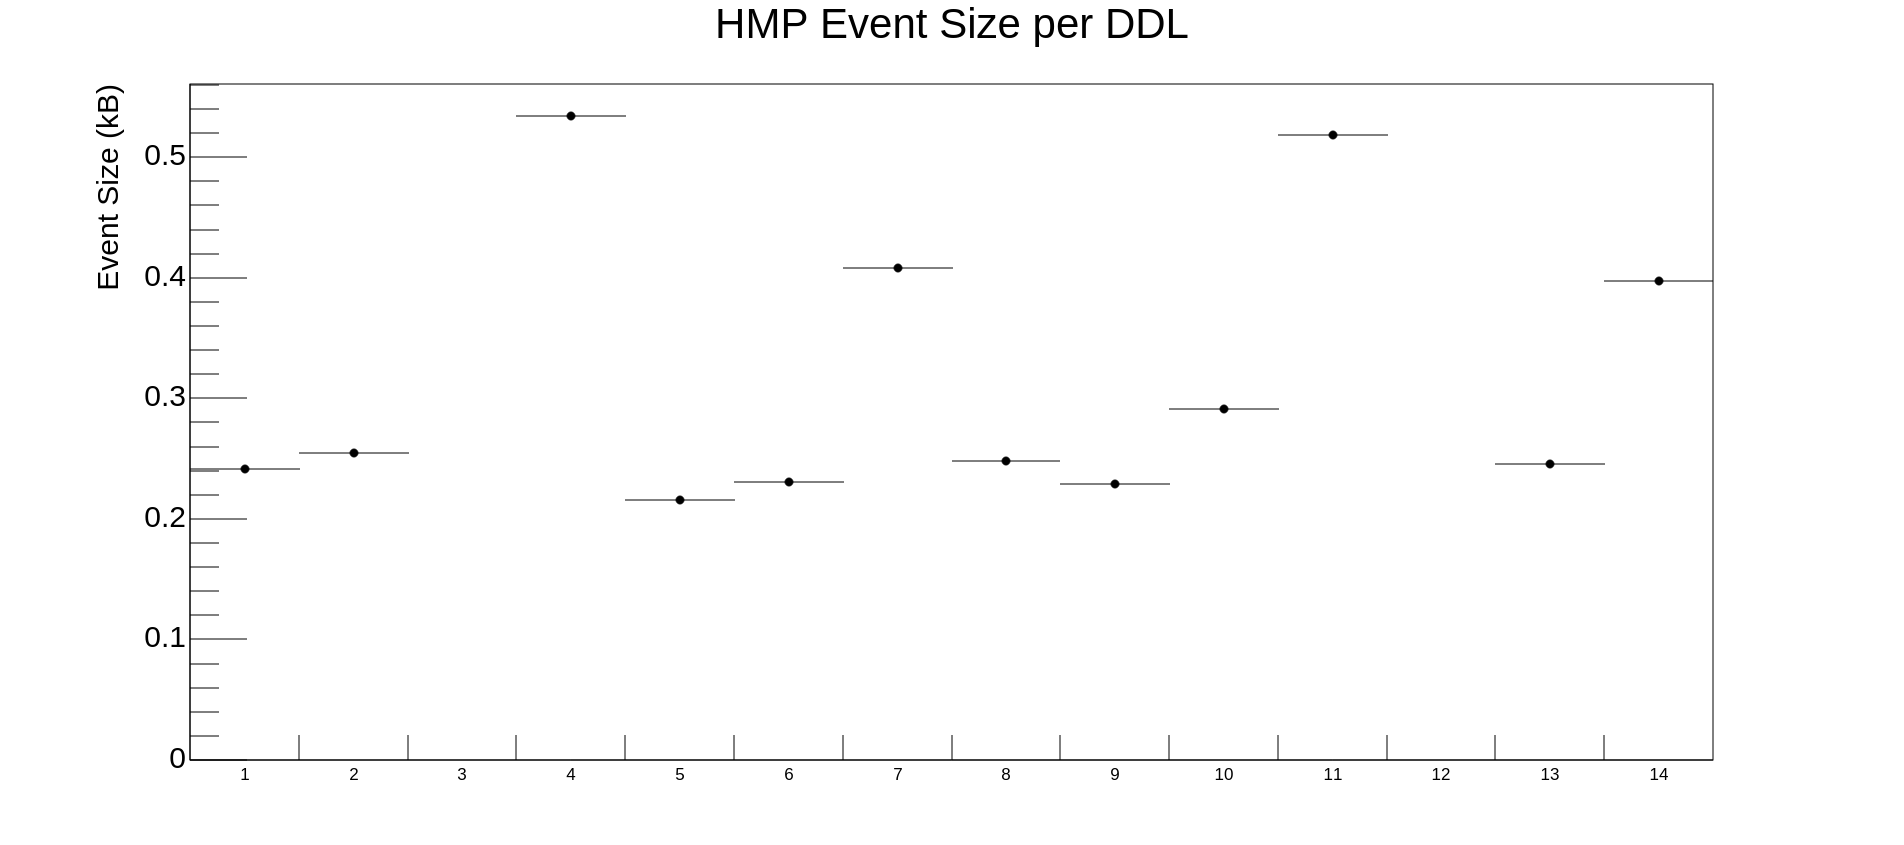
The plot shows the busy time of the detector. In case more than three equipments exceeds 13 kB or the plot is empty call HMP on-call
Sum Q maps#
[QC on FLP]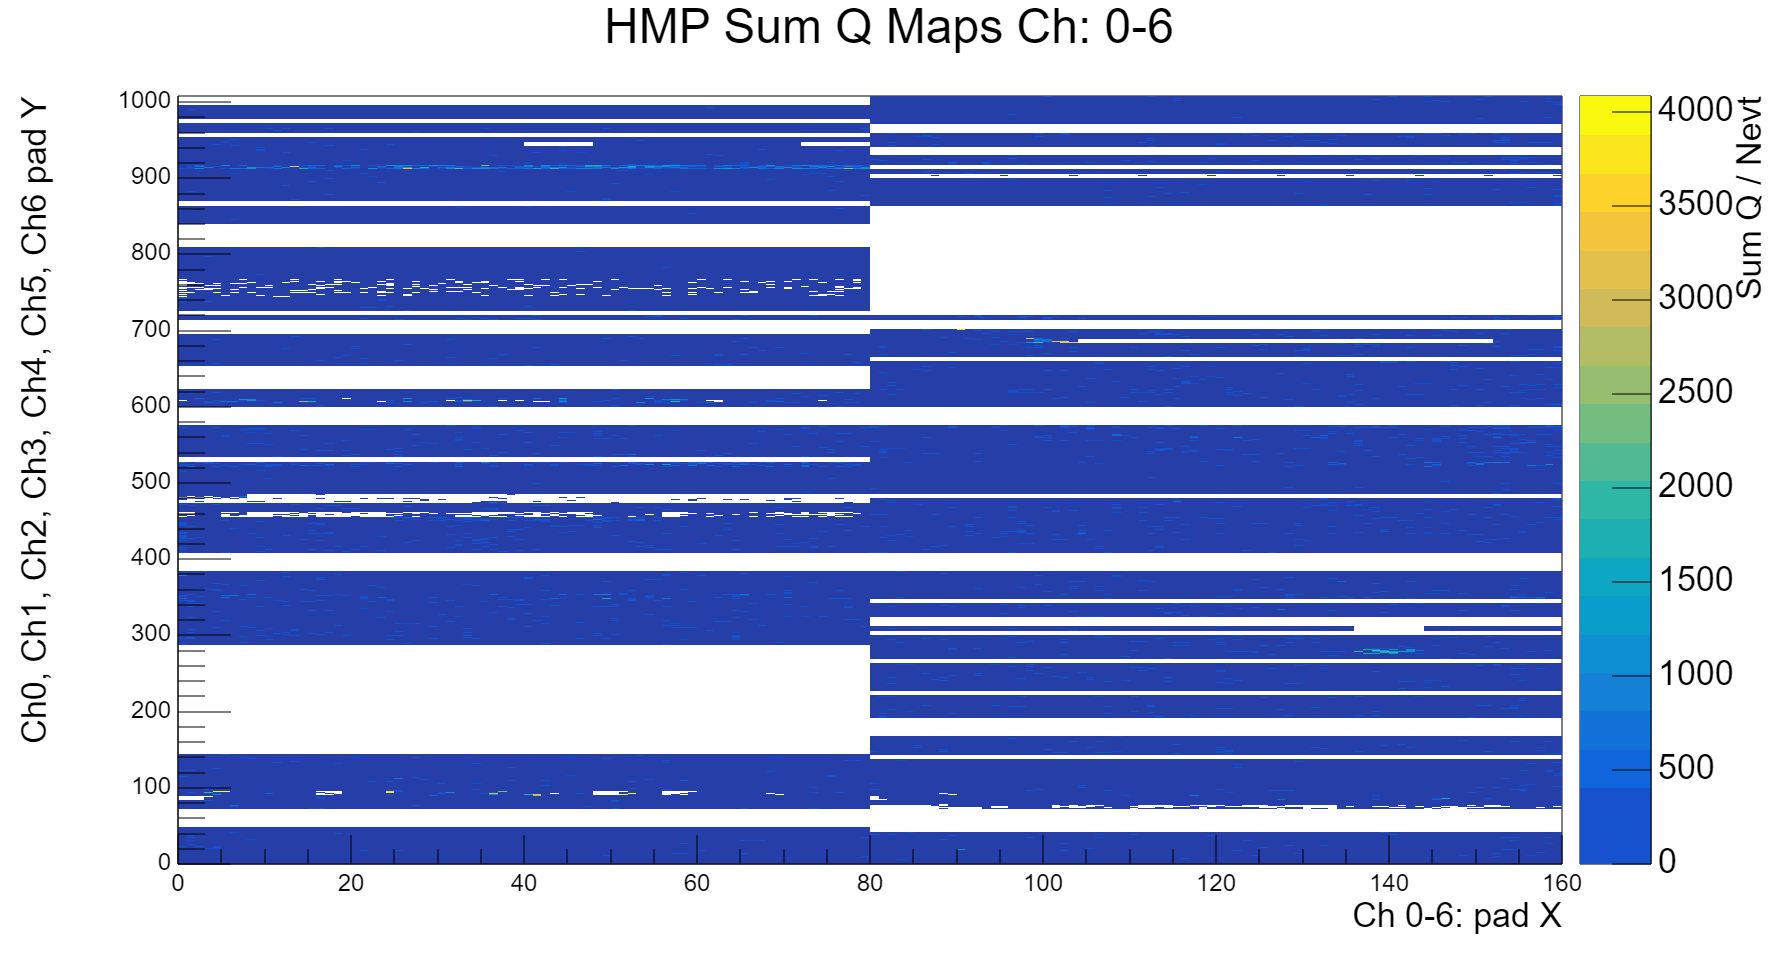
The plot shows the charge of all the detector channels in only one 2D map. It looks like the example plot shown above. In case it is completely empty call HMP on-call.
Charge vs HV sector#
[QC on FLP]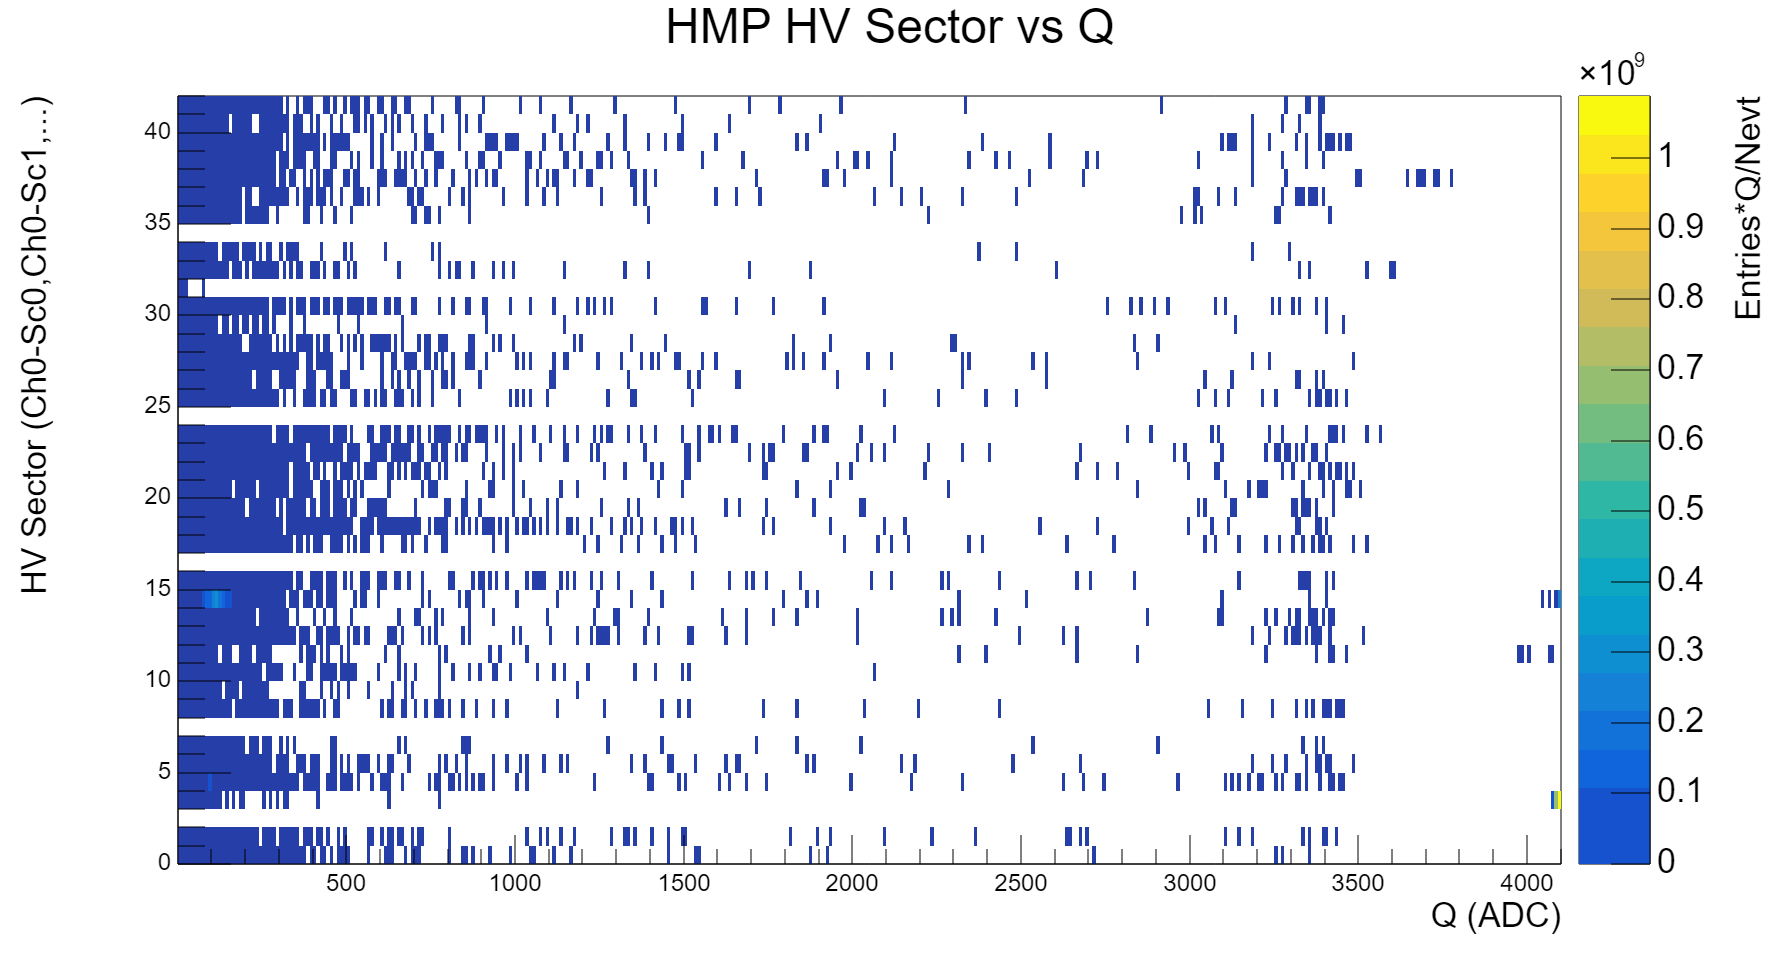
The plot shows the charge of all the detector HV sectors in only one 2D map. It looks like the example plot shown above. The white bands correspond to the faulty HV sectors that are off. In case more than two bands (w.r.t those shown here) became white call the an-call.
Occupancy#
[QC on FLP]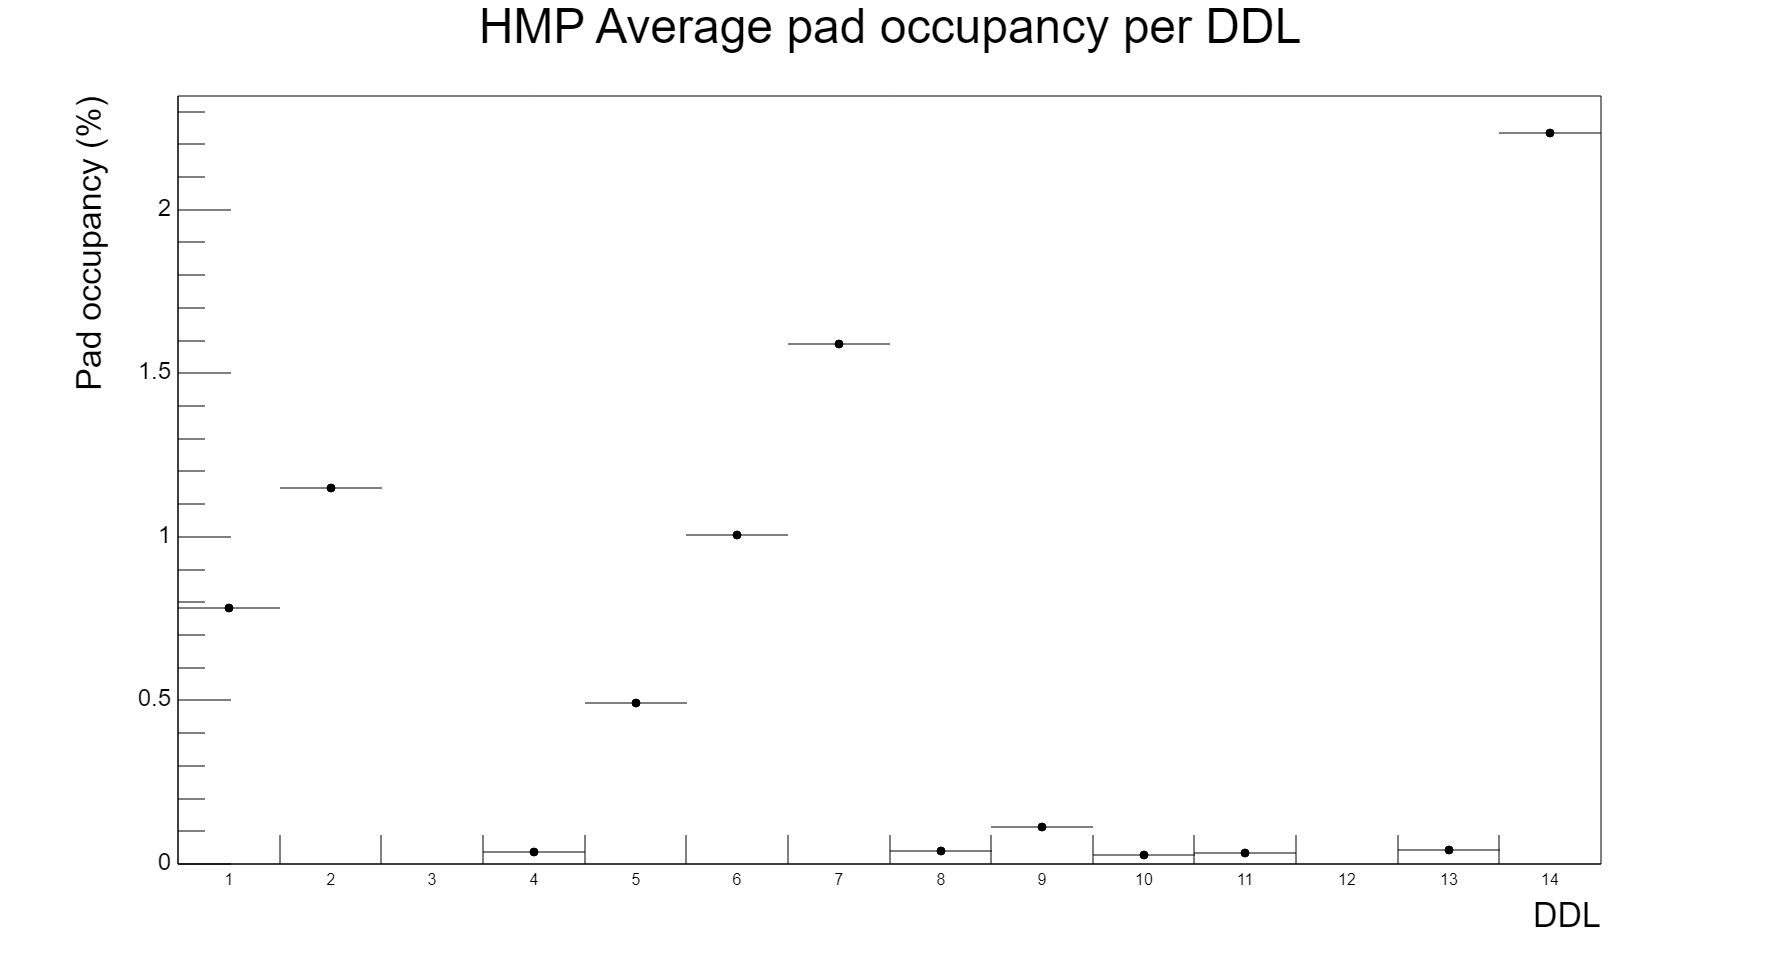
The plot shows the occupancy for each detector DDL. In case more than three equipments exceeds 3% or the plot is empty call HMP on-call
Known issues#
For the moment links 3 and 12, exlcuded from data taking
ITS#
General considerations#
If any of the plots listed in this page remains empty during a run, please call the ITS on-call.
Fake-hit rate overview#
[QC on FLP - plot integrated over the run]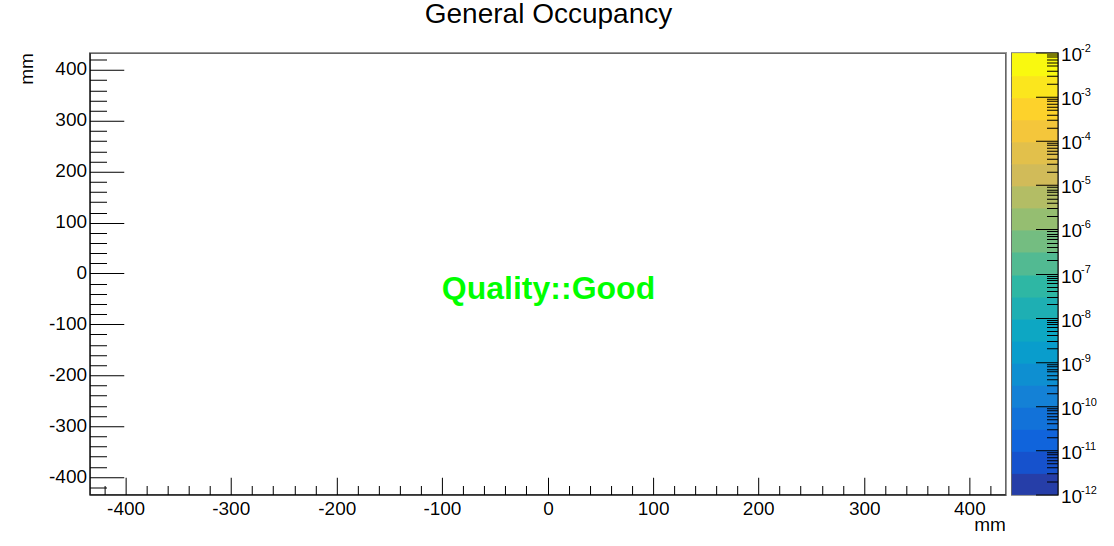 Overview of the fake-hit rate for all ITS staves. In the case of entries, the fake-hit rate is displayed with the colored scale in hits/event/pixel for every stave. For the technical run, this plot is expected to stay empty. Please call the ITS on-call if you see any entries.
Trigger count vs TriggerID and FeeID#
[QC on FLP - plot integrated over the run]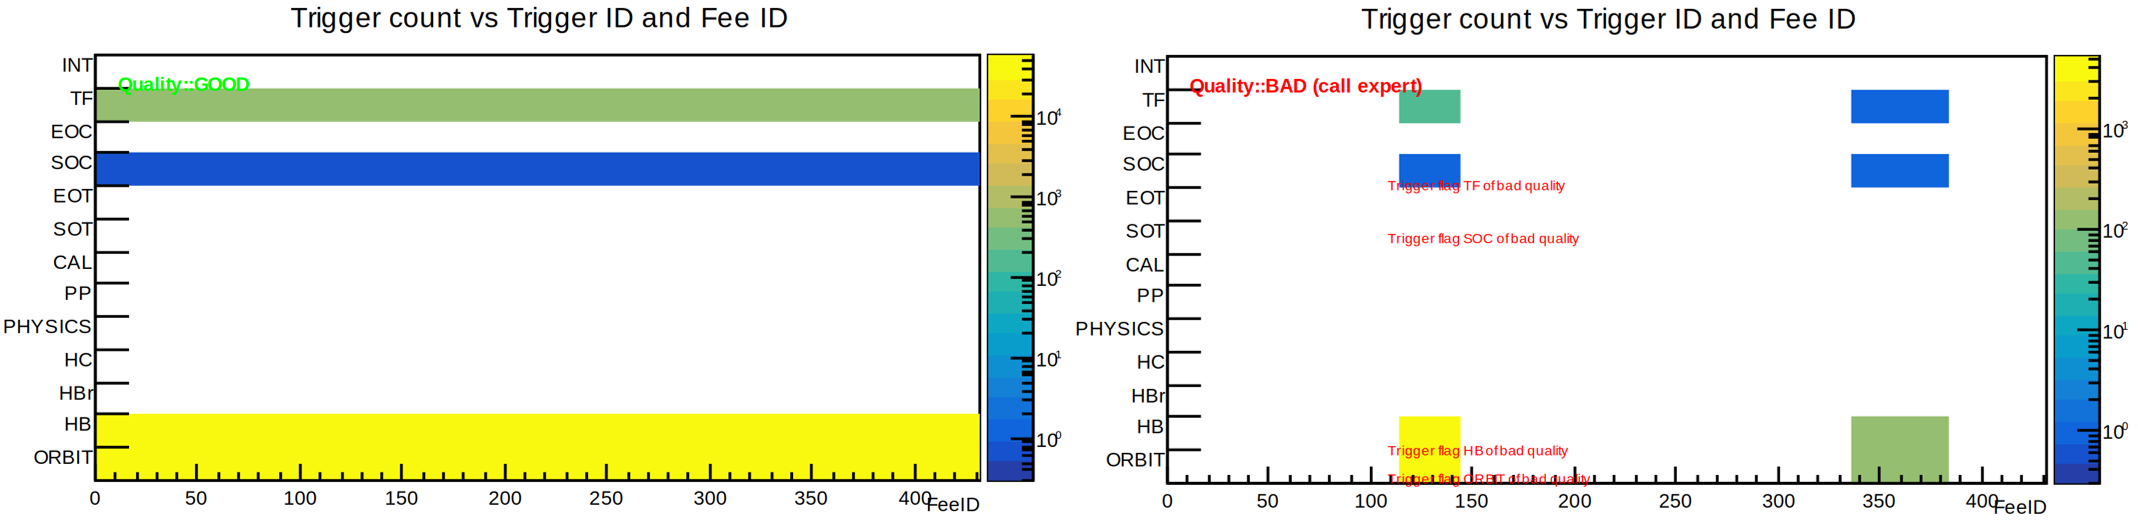 Plot summarizing trigger flags. The colored scale represents the counts in each bin. The normal plot is shown on the left panel, while the problematic one is depicted on the right. QC can plot the following error messages:
- Quality::GOOD
- Quality:: BAD: Trigger flag (TRIGGER_NAME) of bad quality
Call the ITS on-call in the case of BAD quality messages and also in the following cases:
- there are x-bins without entries (i.e., vertical white lines on the plot)
- entries are present in the empty lines in the example plot above.
- the plot is completely empty
Payload size vs FeeID#
[QC on FLP - plot integrated over the run]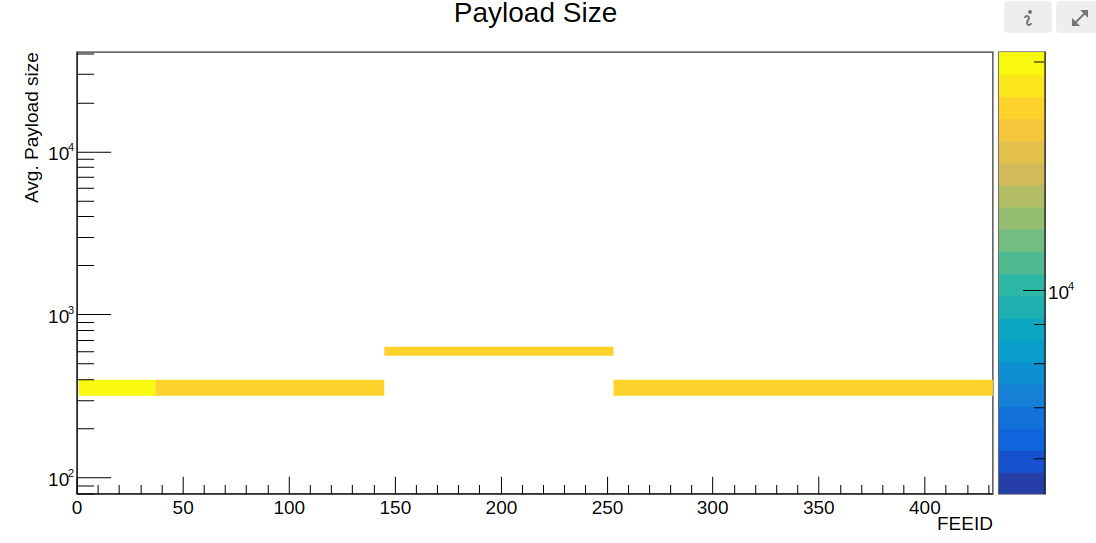
Plot showing the payload size of every link (FeeID). Values on the y-axis must be like in the plot or all identical to each other. QC will provide the following data quality messages for this plot:
- Quality::GOOD
- Quality:: BAD: Payload size too large for technical runs
- Quality:: BAD: Payload size is missing for some FeeIDs
Call the ITS on-call in case of BAD quality messages or plot will differ from the provided example.
Known issues#
ITS KNOWN ISSUES#
MCH#
Quality Summary#
[QC on EPN]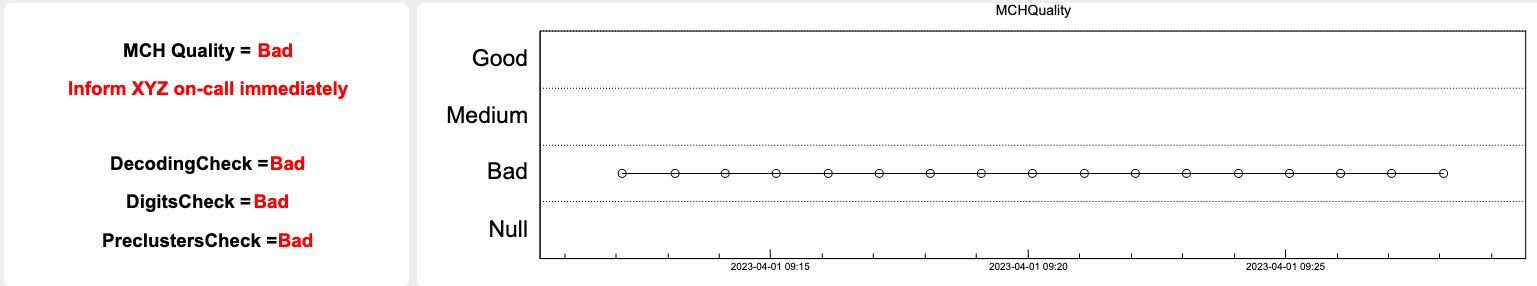
The left panel show a summary of the automated checked on the MCH data, in a human-readable format. The top line describes the aggregated quality status, followed by a message suggesting the appropriate action according to the quality level: * Bad: immediately inform the MCH on-call * Medium: write a logbook entry, tagging MCH * Null: the plots are completely empty. Check in DCS if MCH is in STANBY. If not, inform the MCH on-call.
The right panel shows a trending plot of the aggregated quality. The message in the left panel always corresponds to the most recent point in the trending plot.
If the quality in the trend plot is Bad for the whole duration of a run, MCH should be marked as Bad in the Bookkeeping flags for the run.
Quality Plots#
The following plots show the distribution of various estimators of the MCH data quality. Each horizontal bin shows the value of the monitored quantity, averaged over one Detection Element(DE). The vertical dashed lines show the boundaries between each of the 10 MCH chambers. An horizontal dashed line shows the threshold used by the checker to decide if a given detection element is considered good or bad.
The checker assigns an overall Good (green), Medium (orange) or Bad (red) quality flag to the plot, depending on the number and pattern of bad DEs. In general, the quality is still considered Good if only few DEs are bad. The quality is set to Medium if several DEs are Bad, but no significant impact on the detector acceptance is expected. If the number and pattern of bad DEs is such that the acceptance will be degraded, the quality is set to Bad.
The overall aggregated MCH quality is the logic AND of the qualities of the individual plots.
Fraction of Synchronized Boards#
[QC on EPN]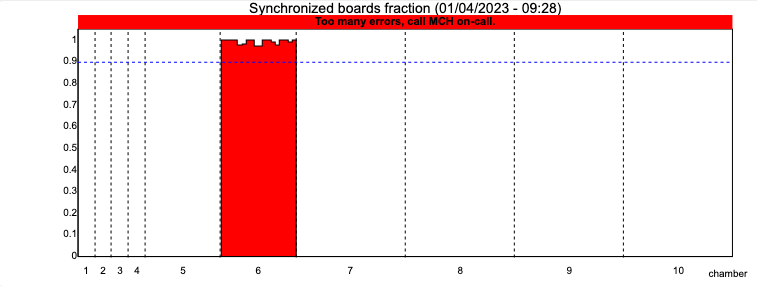
The plot shows, for each Detection Element, the fraction of FEC boards that are properly synchronized. A given DE is coinsidered bad if the corresponding fraction is below the horizontal dashed line.
Fraction of Boards not in Error#
[QC on EPN]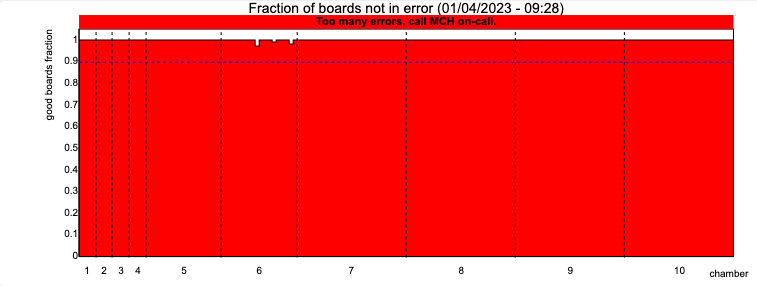
The plot shows, for each Detection Element, the fraction of FEC boards that do not have decoding errors. A given DE is coinsidered bad if the corresponding fraction is below the horizontal dashed line.
Fraction of Boards with Good Rate#
[QC on EPN]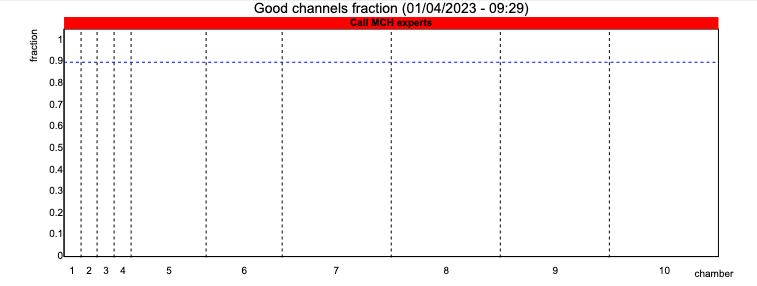
The plot shows, for each Detection Element, the fraction of FEC boards that have a correct hit rate. A given DE is coinsidered bad if the corresponding fraction is below the horizontal dashed line.
Average Hit Rate#
[QC on EPN]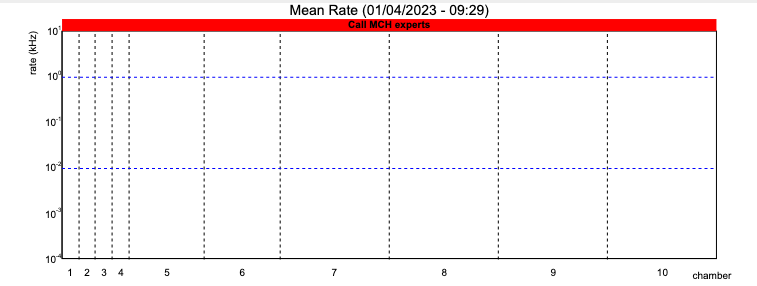
The plot shows the average hit rate (in kHz) for each detection element. A given DE is coinsidered bad if the corresponding rate is below the horizontal dashed line.
Known issues#
-
In SYNTHETIC runs, MCH global quality may depend on the replay configuration
- in p-p replay (500 kHz) : MCH run global quality is expected to be good. If quality is bad or medium, notify the on-call via a logbook entry
- in PbPb replay : MCH run global quality is expected to be good. If quality is bad or medium, notify the on-call via a logbook entry
- in OO replay (oo-35khz-synt-8tf) : MCH run global quality is expected to be bad (Precluster and tracks quality : bad). No need to notify the on-call via a logbook entry.
- other replay settings : MCH run global quality may oscillates between good and bad. If quality is bad or medium, notify the on-call via a logbook entry
-
In TECHNICAL runs, MCH global quality depends on the DCS state of MCH
- if MCH state is READY : MCH global quality should be good. If MCH global quality is bad a notification via a logbook entry is enough.
- if MCH state is BEAM_TUNING (BEAM_TU) or STANDBY_CONFIGURED (STDB_CO): MCH global quality is expected to be bad. Only the "Decoding errors" is expected to have a good quality; if this is not the case a notification via a logbook entry is enough.
-
In COSMICS runs, the low number of tracks makes it difficult to compute the efficiency for all detection elements in each cycle. Hence oscillations between good and bad status should be expected.
- if Bad Preclusters quality: Bad Mean Efficiency vs DE(B) and Mean Efficiency vs DE(NB) show multiple bins below threshold value. This is a known issue, no need to notify.
- if the global quality is bad continuously for more than 1 hour, please make a notification via a logbook entry.
-
FLP Infologger
- QC plots have been disabled and will generate some errors about not-found plots that can be ignored, for instance :
- Requested resource does not exist: ali-qcdb.cern.ch:8083/qc/MCH/QO/DecodingCheck/1709911754085/PeriodName=LHC24aa/RunNumber=548050/
- Requested resource does not exist: ali-qcdb.cern.ch:8083/qc/MCH/QO/PreclustersCheck/1709911754085/PeriodName=LHC24aa/RunNumber=548050/
- Requested resource does not exist: ali-qcdb.cern.ch:8083/qc/MCH/QO/DecodingCheck/1709911754085/PeriodName=LHC24aa/RunNumber=548050/
- QC plots have been disabled and will generate some errors about not-found plots that can be ignored, for instance :
MID#
Local boards occupancy map (DigitsQC)#
[QC on EPN]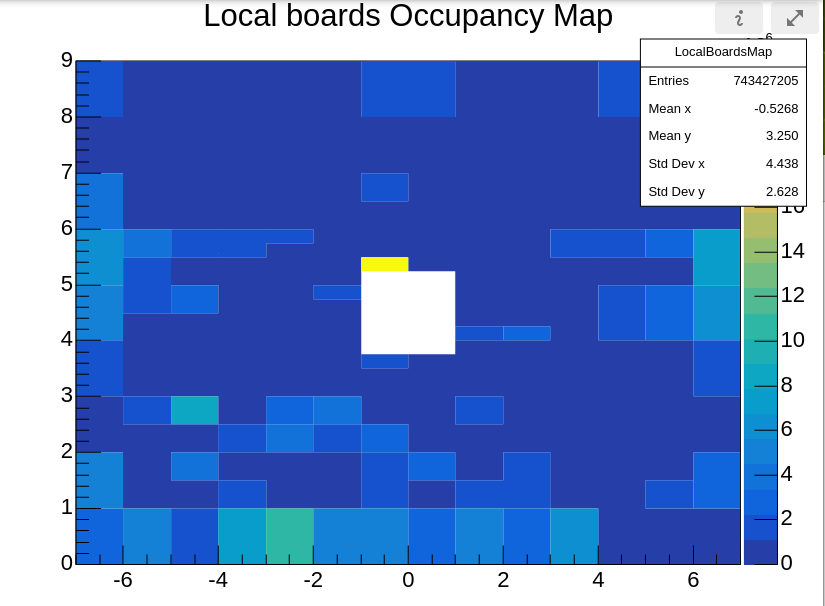
The plot shows fired local Boards. In case of :
-
empty column.
-
empty or very high rate on several neighboring boards of the detector.
call expert in case of PHYSICS or COSMIC run
Hits multiplicity (DigitsQC)#
[QC on EPN]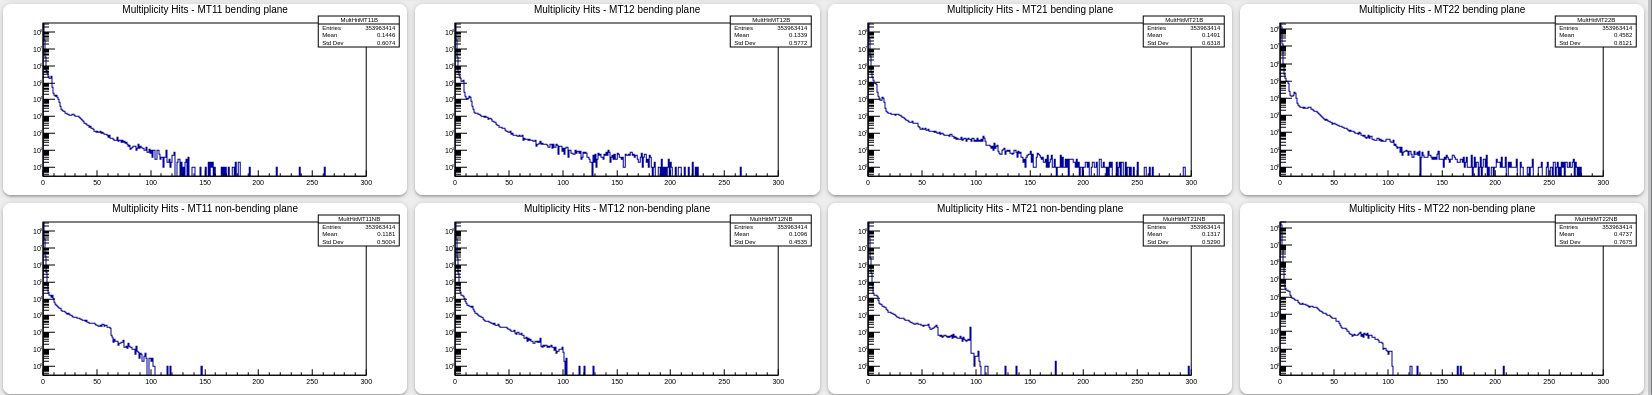
These plots show hits multiplicity by plane for bending and non-bending
-
if mean value > 100.
call expert
Known issues#
- MID has some empty bins in SYNTETHIC runs on "Local boards Occupancy Map" plot. Ignore them till it will be fixed
PHS#
Technical runs#
Monitor if plots are not empty and timestamps are updated.
Ignore any red messages except "Number of entries has not changed in the past cycle".
If you see "Number of entries has not changed in the past cycle" but run is still ongoing then most probable reason is that PHS bacome busy. You can check with ECS shifter and inform the on-call if he is not informed yet. If PHS is not busy but you see this message then inform the on-call.
[QC on EPN] Cell HG occupancy in M1, M2, M3, M4#
Good plots:
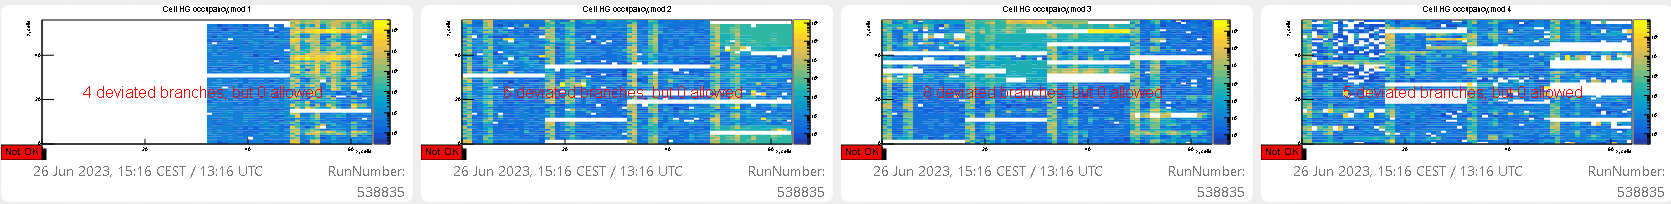
The plots represent number of cells seen in each channel. It should be more or less populated. In case when it is very different from reference please inform PHS on-call.
[QC on EPN] Error occurance#
Good plot:
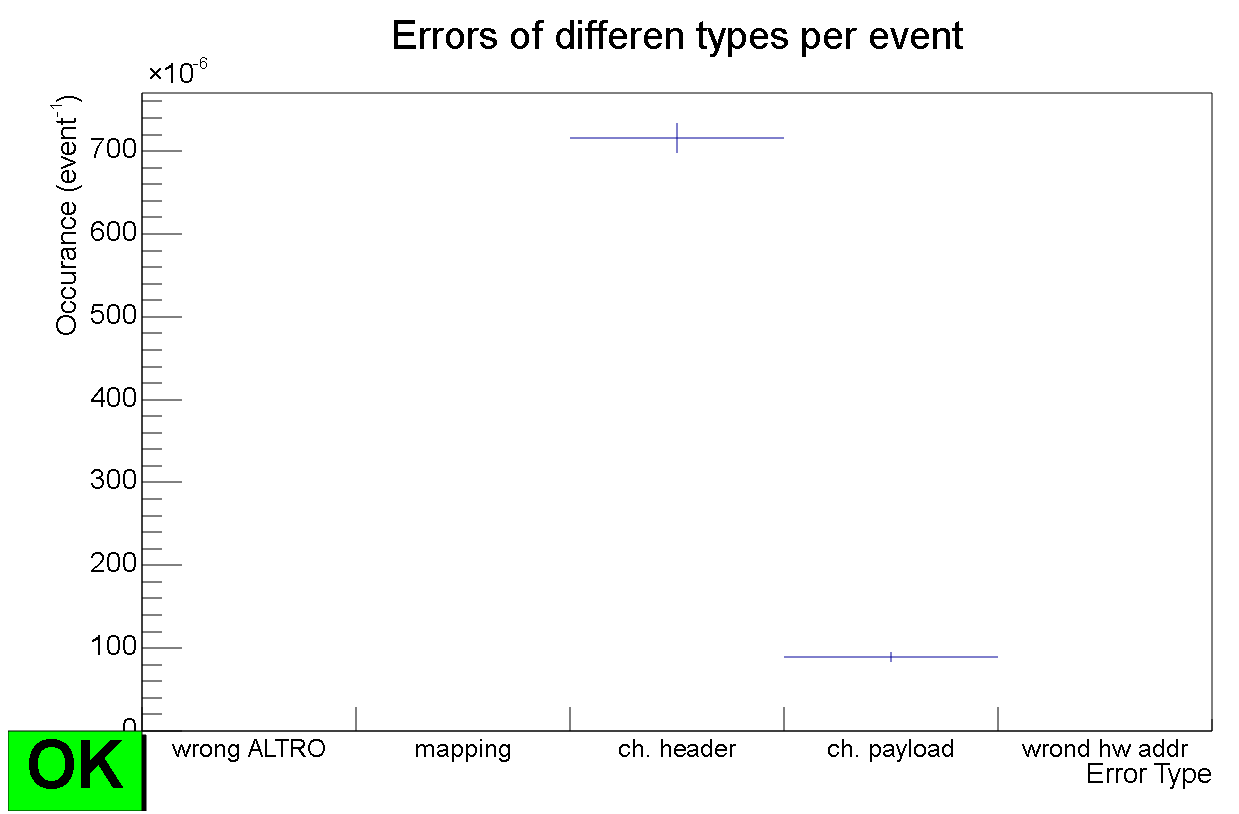
If plot is not good then please inform the oncall. If medium then put a log entry and inform the oncall during morning and afternoon shift. No need to call at night if there are no other issues. No need to put bad flag for run if there are no other issues.
Minimal duration after SOR before taking any action required by these instructions: 10 min
Known issues#
- COSMIC, TECHNICAL, PHYSICS_PP runs Cell HG occupancy, mod[1-4]: white horizontal stripes can be seen which differs from the reference plots. QC shifter can ignore these patterns, because they are caused by dynamic FEE mask which is changed by the PHOS experts without prior notice. Only completely empty plots should be reported by the QC shifter to PHOS/CPV on-call
- COSMIC, TECHNICAL, PHYSICS_PP runs Cell HG occupancy, mod1 shows missing data in the area x=(32,47);z=(0,27) since end of March 2023. This is a known issue and is being investigated by PHS experts. No need to report it in the QC EOS reports and no calls to PHS/CPV shifters are needed.
- COSMIC, TECHNICAL, PHYSICS_PP runs. Sometimes QC shifters report on the error message in EPN infoLogger: Trailer decoding error: Last RCU trailer word not found. These errors are persistent, they appear in all COSMIC, TECHNICAL, PHYSICS runs since the beginning of Run3, and caused by a bug in SRU firmware. All these errors should be ignored.
TOF#
Ignore alarms if TOF is not READY
Readout map (Slot Participating)#
[QC on FLP - plot integrated over the run]
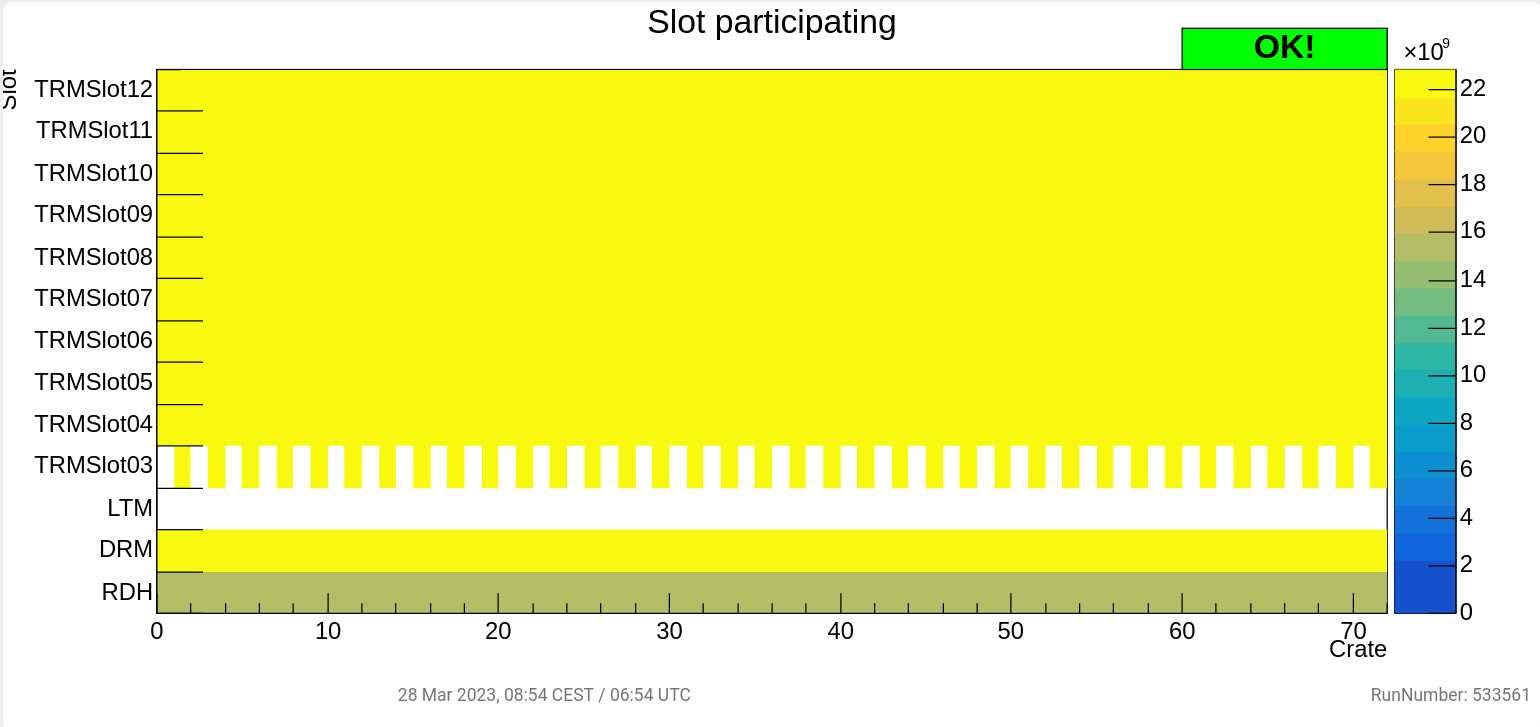
The plot shows a map of TOF readout slots per crate. The checker controls if enough crates are in the readout, if it detects lower than expected the quality is set to BAD. In case of red allarm please call TOF oncall.
Hit Multiplicity#
[QC on EPN - plot integrated over the run]
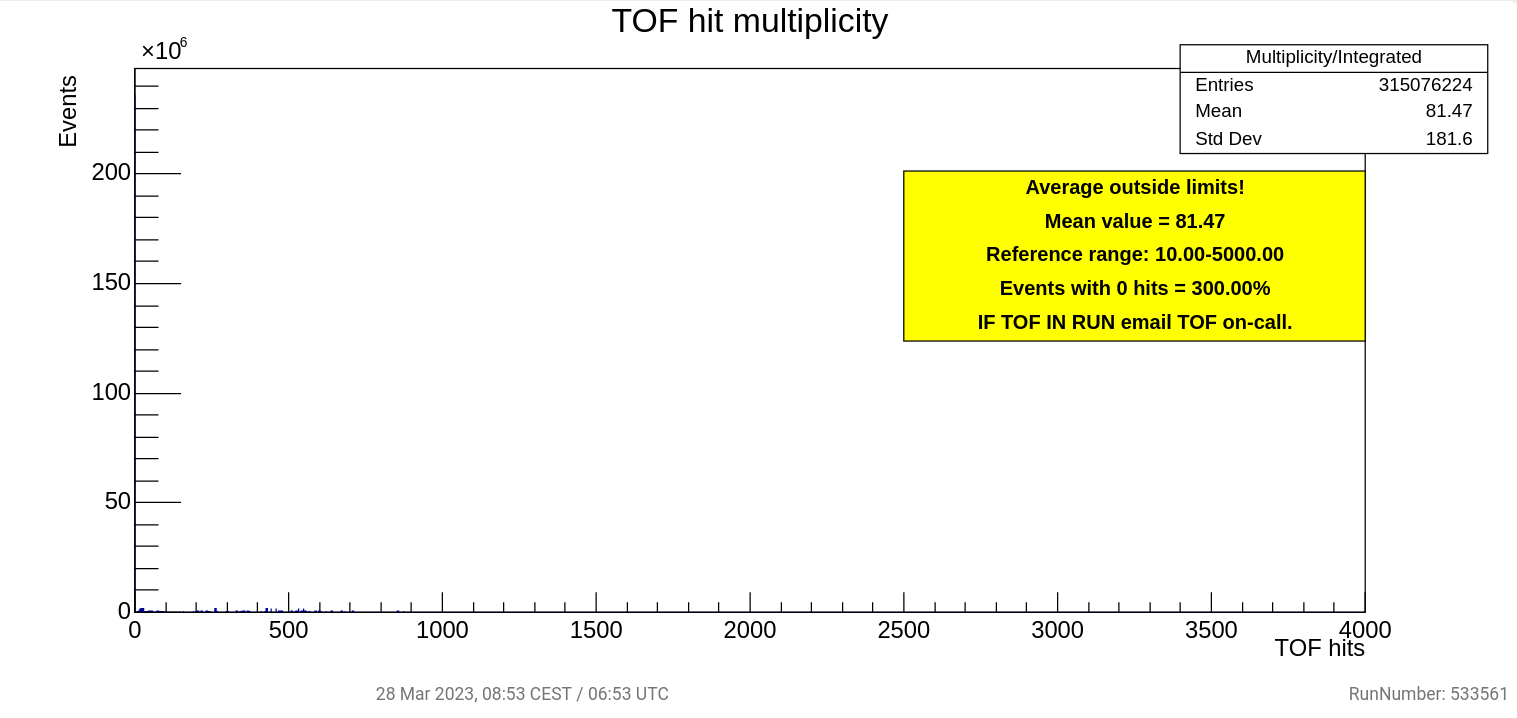
The plot shows the number of hits detected by TOF, a checker provides instructions for the shifter based on measured counts. ~~In case of yellow allarm please contact TOF on-call via email, in case of red alarm call TOF expert.~~
Known issues#
Slot Participating will not update in REPLAY Runs, this is a known issue do not call the oncall.
TPC#
TPC Technical#
Quality Observer / Number of RawDigits / Quality Trending#
[QC on EPN]
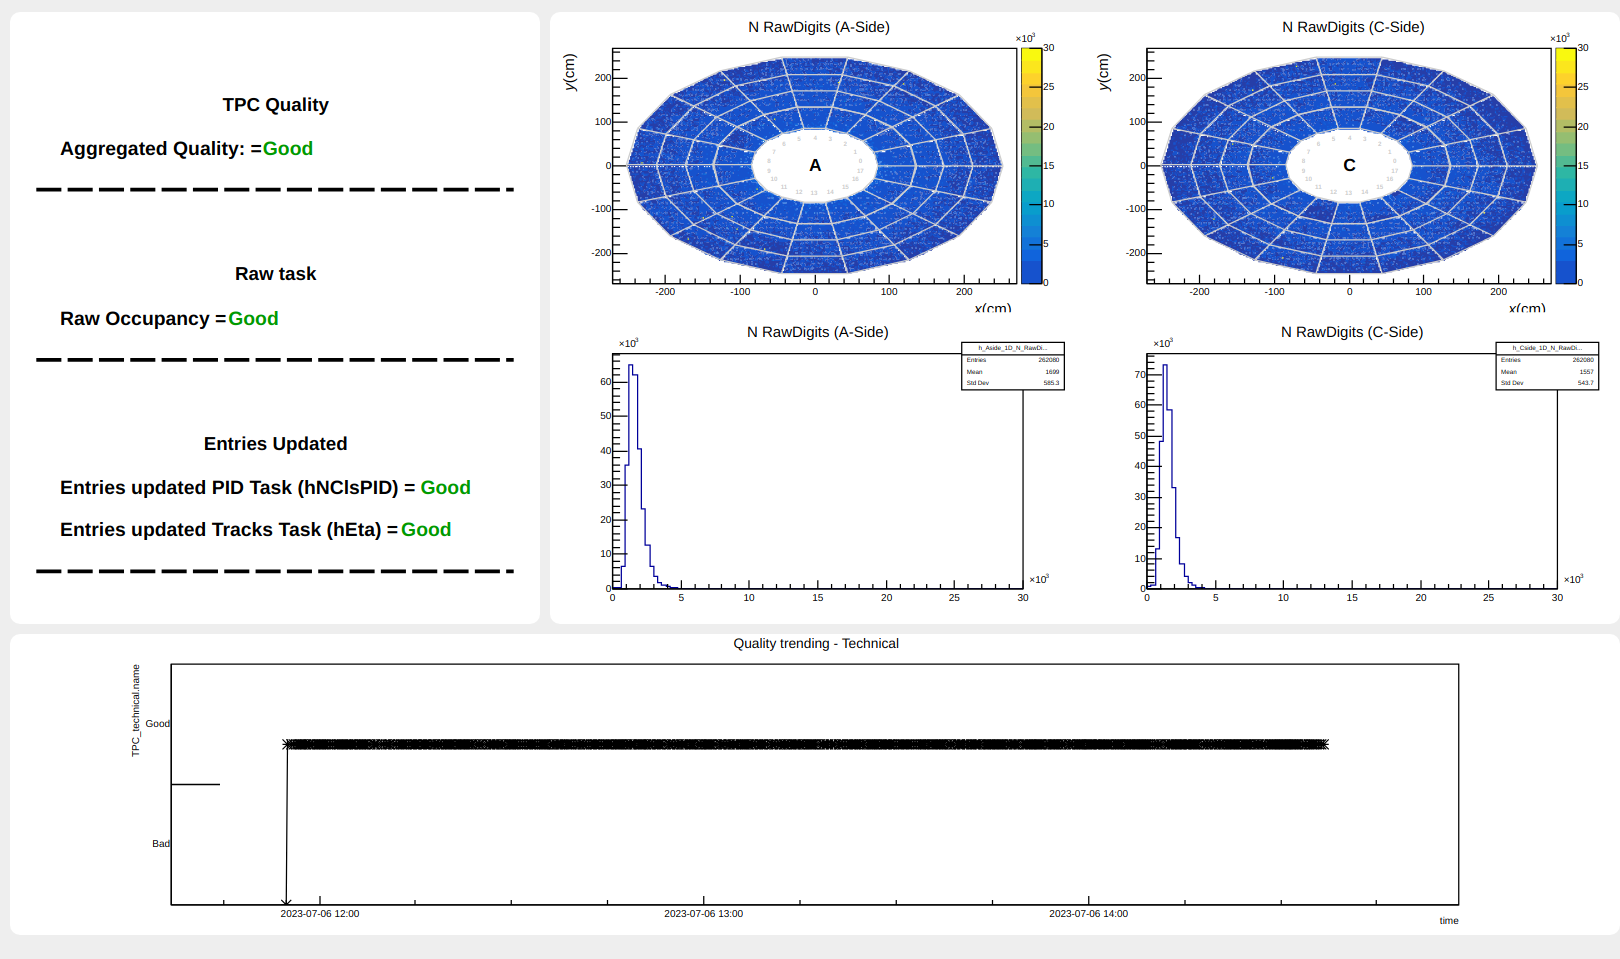 To be checked:
-
The time stamp at the bottom should update every two 2 minutes during running.
-
When run is ongoing all Qualities in the list should be GOOD after 3 update cycles (6 minutes). In case of a bad quality put log entry.
-
If in the quality trending, the quality is constantly BAD for multiple cycles (>10 minutes) call On-Call.
-
In case the Raw task quality is bad you can check if there are holes in the N RawDigits plots and call On-Call.
Known issues#
Occasionally, the 'Calib' QO may go red; this is an issue with the interplay of the validity of two objects. Please ignore if this behaviour is not persistent (work in progress).
TRD#
Experts will check quality of technical runs
Known issues#
QC plots for COSMICS are not consistent with the documentation.
- For the "Data sizes from HalfCRU header" plot shows deviations due to noisy sectors (values around 2500). This issue can be ignored till documentation is up to date.
- For the "Number of Tracklets per timeframe" plot has a double peak structure in COSMICS and a lot of entries in the underflow bin (around 90% of tracklets). The experts have been notified. The relevant log can be found here: https://ali-bookkeeping.cern.ch/?page=log-detail&id=80122. The issue may be fixed in future or the documentation updated.
ZDC#
General considerations#
If any of the plots listed in this page remains empty during a run, please write a mattermost message to the ZDC on-call
- Typical Data Rate: 54 MB/s
- Run duration: To manually stop
- DCS state: SS
This run will not create any object in the CCDB.
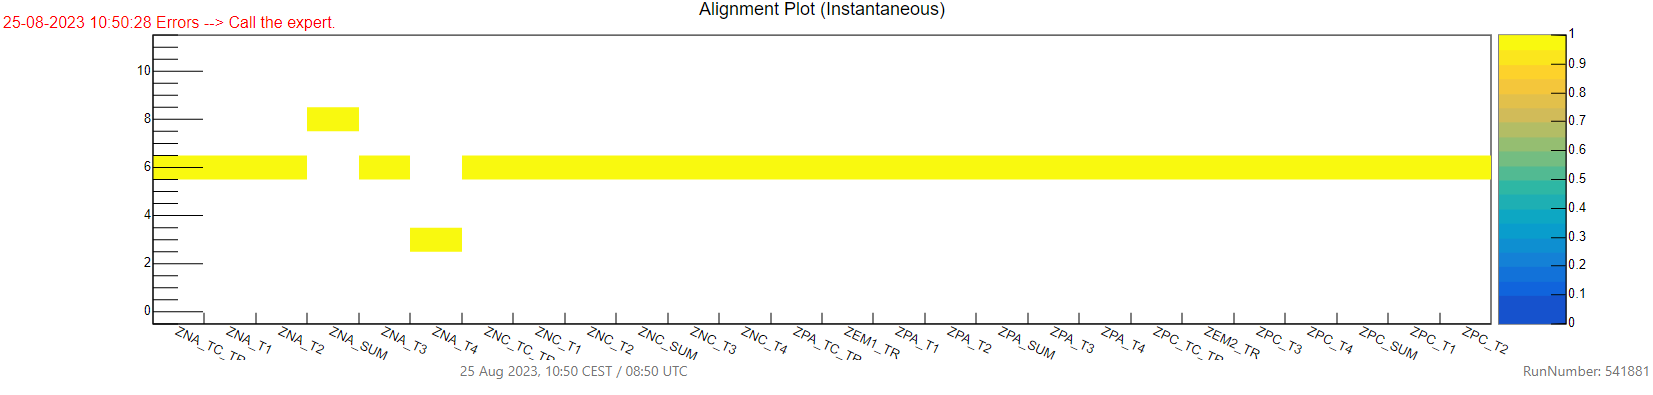
Alignment#
[QC on FLP]
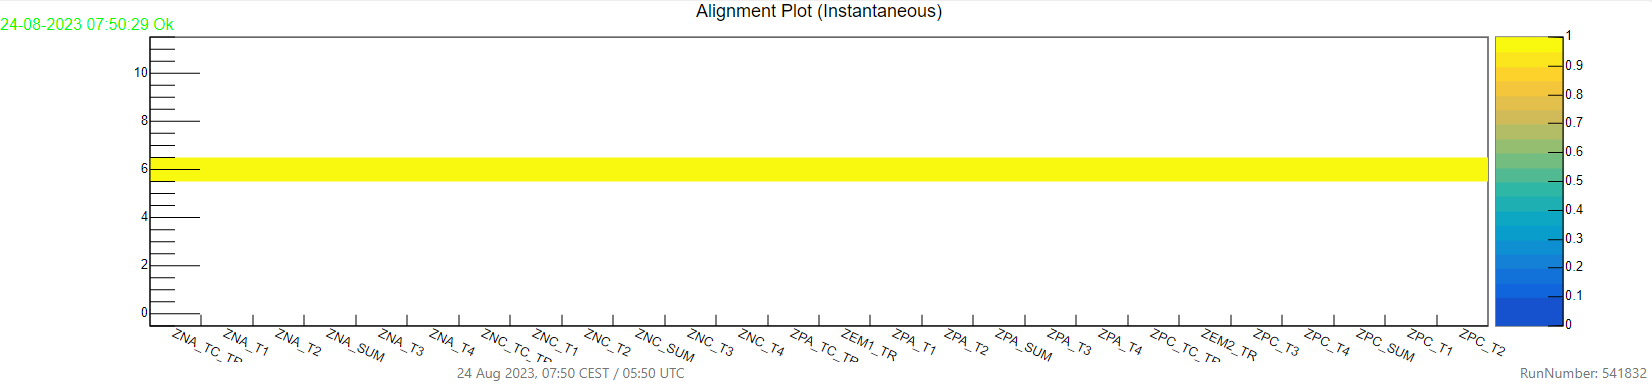
A plot related to a good calibration will have every channel aligned to sample 6 like in the picture. Otherwise it will be considered bad, as in the picture below.
If this plot is empty or shows an error, please write a mattermost message to the ZDC on-call.
Please remember that this plot must not have empty channels, the only good output is the one in the picture.
Below is an example of bad plot.
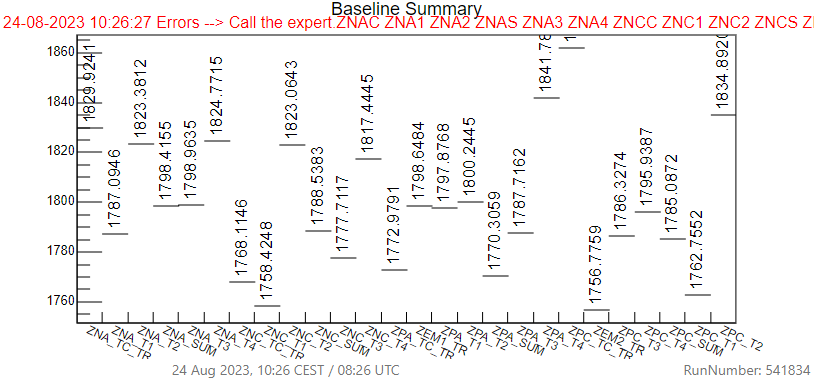
Baseline Summary#
[QC on FLP]
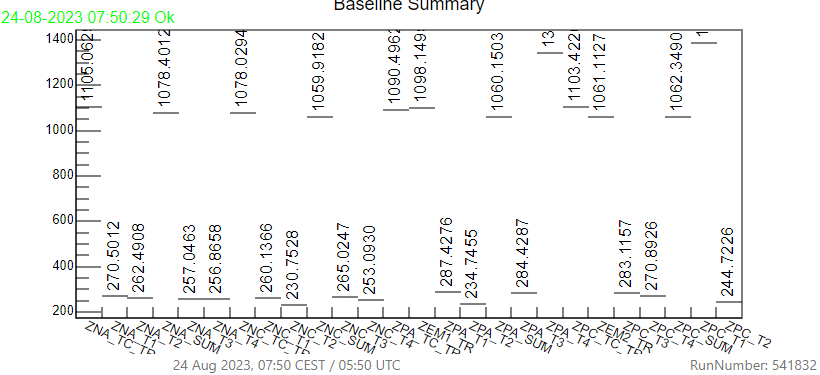
This plot is self-checking, just look if the run number is correct and the status is OK as in the picture above.
If this plot is empty or shows an error, please write a mattermost message to the ZDC on-call. Below is an example of bad plot.
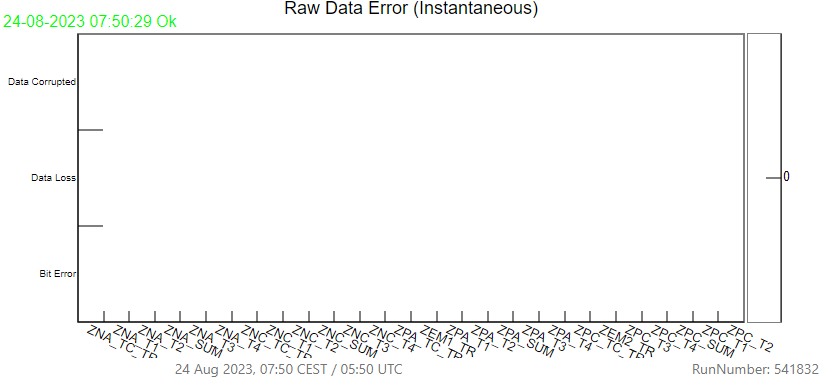
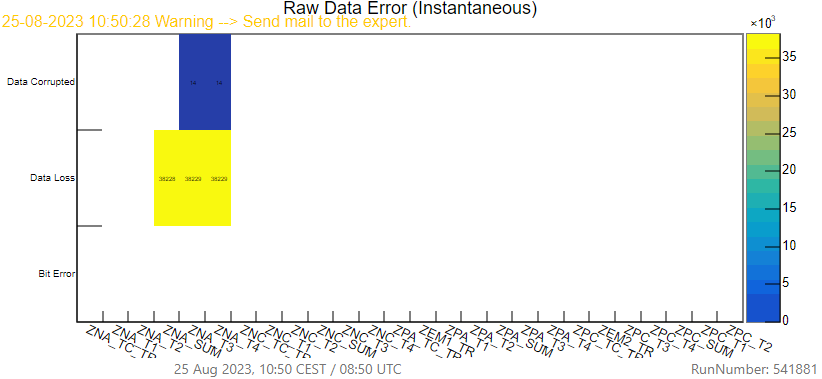
Raw Data Error#
[QC on FLP] This plot should always be empty, if at the end of the run there are entries please write a mattermost message to the ZDC on-call. Please remember to check the run number at each run.
Example of good plot:
Example of bad plot:
Rate#
[QC on FLP]
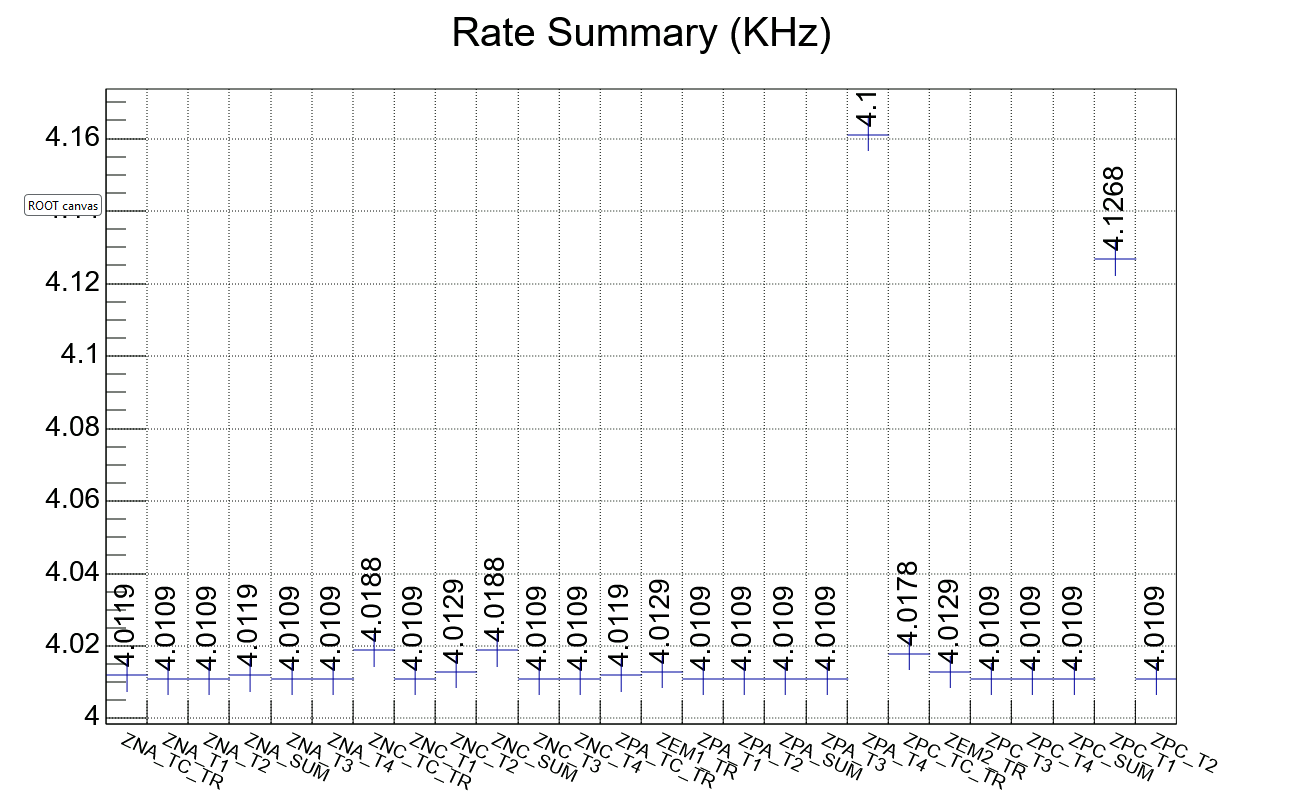
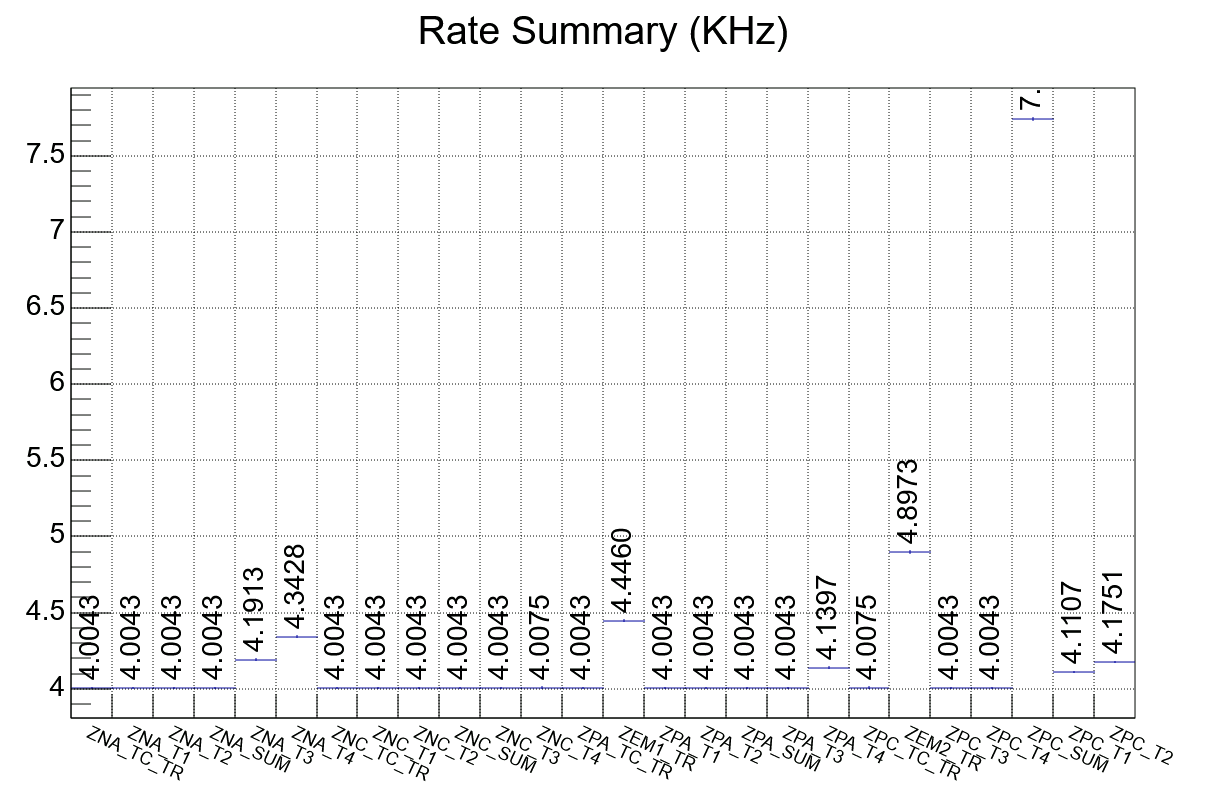
A good plot will have every channel at (4.0+-0.2) KHz. If any channel does not respect that please write a mattermost message to the ZDC on-call. Please remember to check the run number at each run.
Example of bad plot:
Known issues#
FLP InfoLoger: message: "Baseline Error in PED_Z%" message: "Rec Error in ADC_Z%" Detector ZDC. During SYNTHETIC runs this can be ignored.