Calibrations#
A specific shifter layout is used during calibration runs: CALIBRATIONS
QC Shifter Duties#
- When a calibration run is started check the quality using the corresponding instructions for that calibration given below.
- If calibration run is succesful in QC, confrim with SL and mark in the bookkeeping page of the run the Calibration Status field to
SUCCESS. - If calibration is BAD, confirm with SL, take required steps to habdle the problema and mark the Calibration Status field as
FAILED.
Note: The field Run Quality is to be marked by the SL if not instructed otherwise below.
CPV#
CPV_Ped: Pedestal runs#
Usually pedestal runs are done once per fill (in the beginning of each fill). This is short run, and pictures in the QC must appear only once. Everything happens on single CPV FLP. If pictures are empty call the on-call. Please check if run number on the plots corresponds to last taken pedestal run.
Pedestal value distribution#
[QC on FLP]
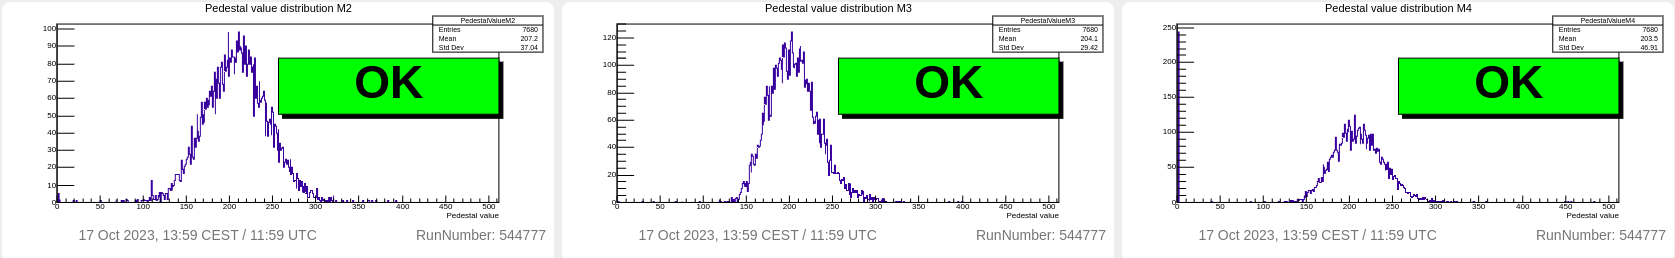
The plot shows 1D pedestal value distribution in module. If red messages appear on the plot then call the oncall and report the message.
Pedestal sigma distribution#
[QC on FLP]
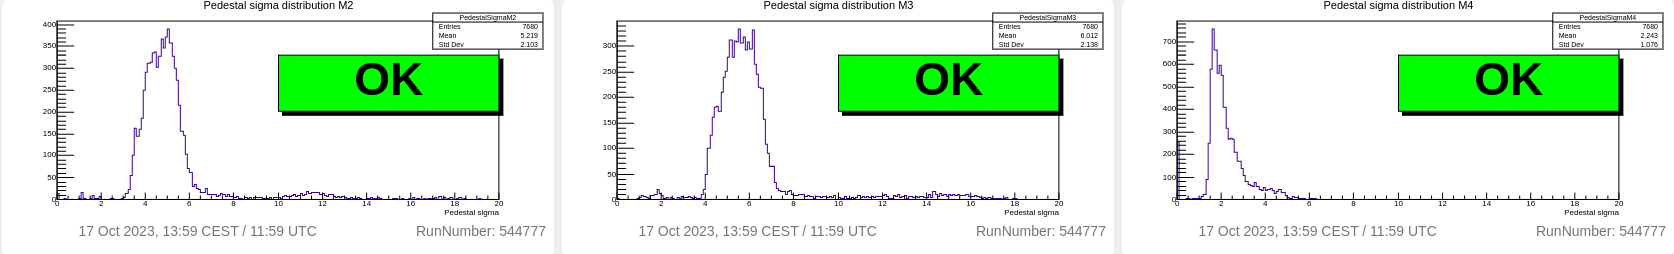
The plot shows 1D pedestal sigma distribution in module. If red messages appear on the plot then call the oncall and inform about the message you see.
Pedestal efficiency distribution#
[QC on FLP]
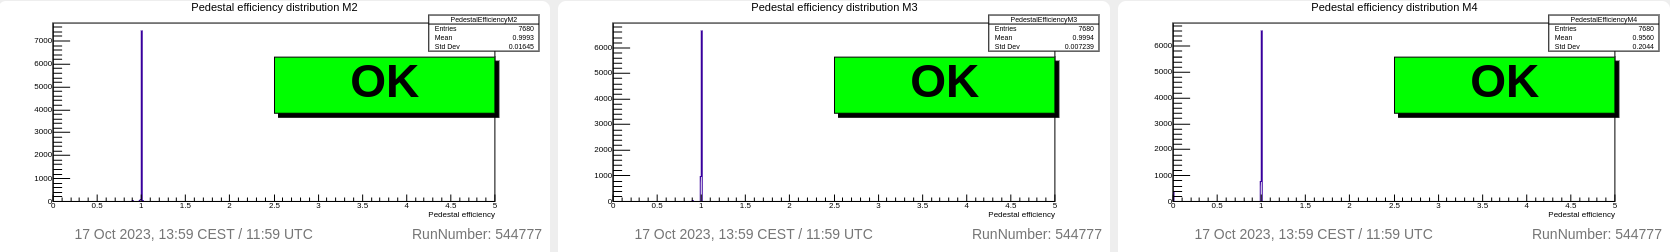
The plots show 1D pedestal efficiencies distribution. Efficiency values should be close to 1. If red messages appear on the plot then call the oncall and inform about the message you see.
Check CCDB objects from CPV pedestal calibration#
At the end of CPV calibration runs, the CCDB objects are created: Pedestals in O2 CCDB FEE thresholds in DCS CCDB QC shifters are invited to check that both objects are created by the last pedestal calibration run (run number is found in the column Metadata).
CPV_Noise: noise scan runs#
Usually noise scans are done once per fill (in the beginning of each fill, right after pedestal run).
If pictures are empty call the on-call.
Please check if run number on the plots corresponds to last taken noise scan.
CPV noise digit map#
[QC on FLP]
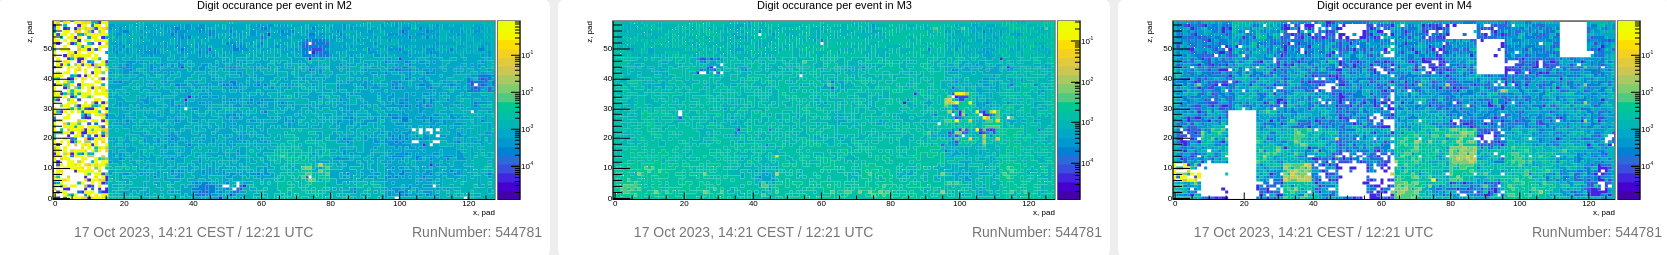
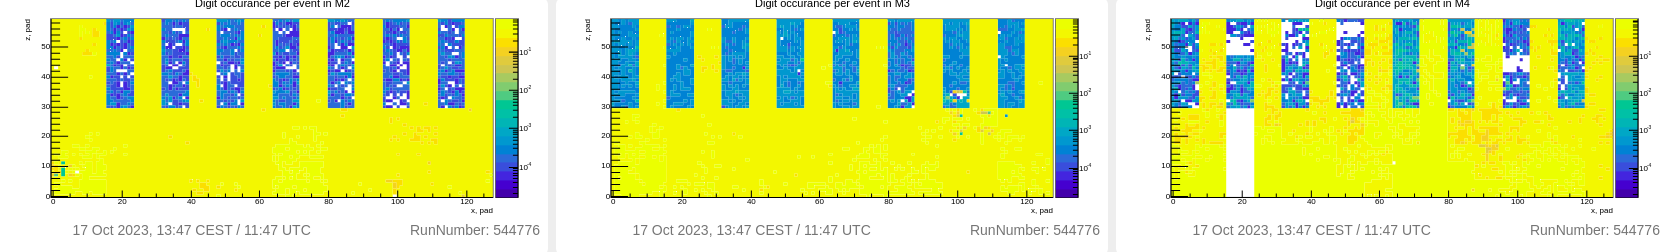
The plots show 2D maps of digit occurance per event.
Please monitor if pictures were updated and do not differ too much from reference plot.
Values in most channels must be at level 10⁻³ - 10⁻². If there are many regions with values of order 10⁻¹ then inform the oncall.
Bad example.
CPV noise digit amplitude spectra#
[QC on FLP]
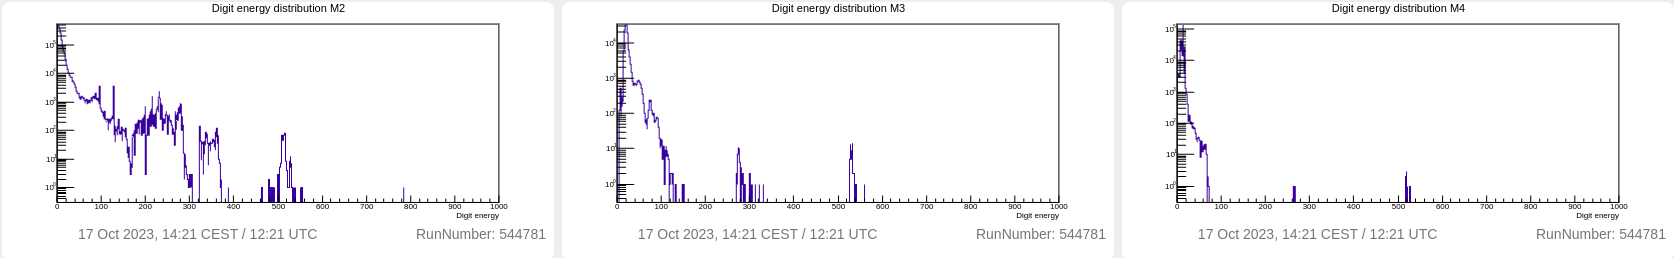
The plots show 1D amplitude distribution of digits in noise scan. It should have peak at zero and fastly drop down. Spikes are possible.
Please monitor if pictures were updated and not empty.
Check CCDB objects from CPV noise calibration#
At the end of CPV noise calibration runs, the CCDB object is created: Bad channel map in O2 CCDB QC shifters are invited to check that the objects are created by the last noise calibration run (run number is found in the column Metadata).
FT0#
FT0_LASER_AGING: Aging monitoring#
The FT0 aging monitoring run collects data that is analyzed offline to monitor detector aging.
- The run should be started after each end-of-fill
- The detector must have been READY since > 1h
- There is no online QC for this run, it only stores CTFs using 1 FLP and 2 EPNs.
- The run stops automatically after 1 minute.
Expected readout rate#
The FLP readout rate should be around 17 MB/s. If no FLP readout, or a deviation of more than 50%, please contact the FIT on-call.
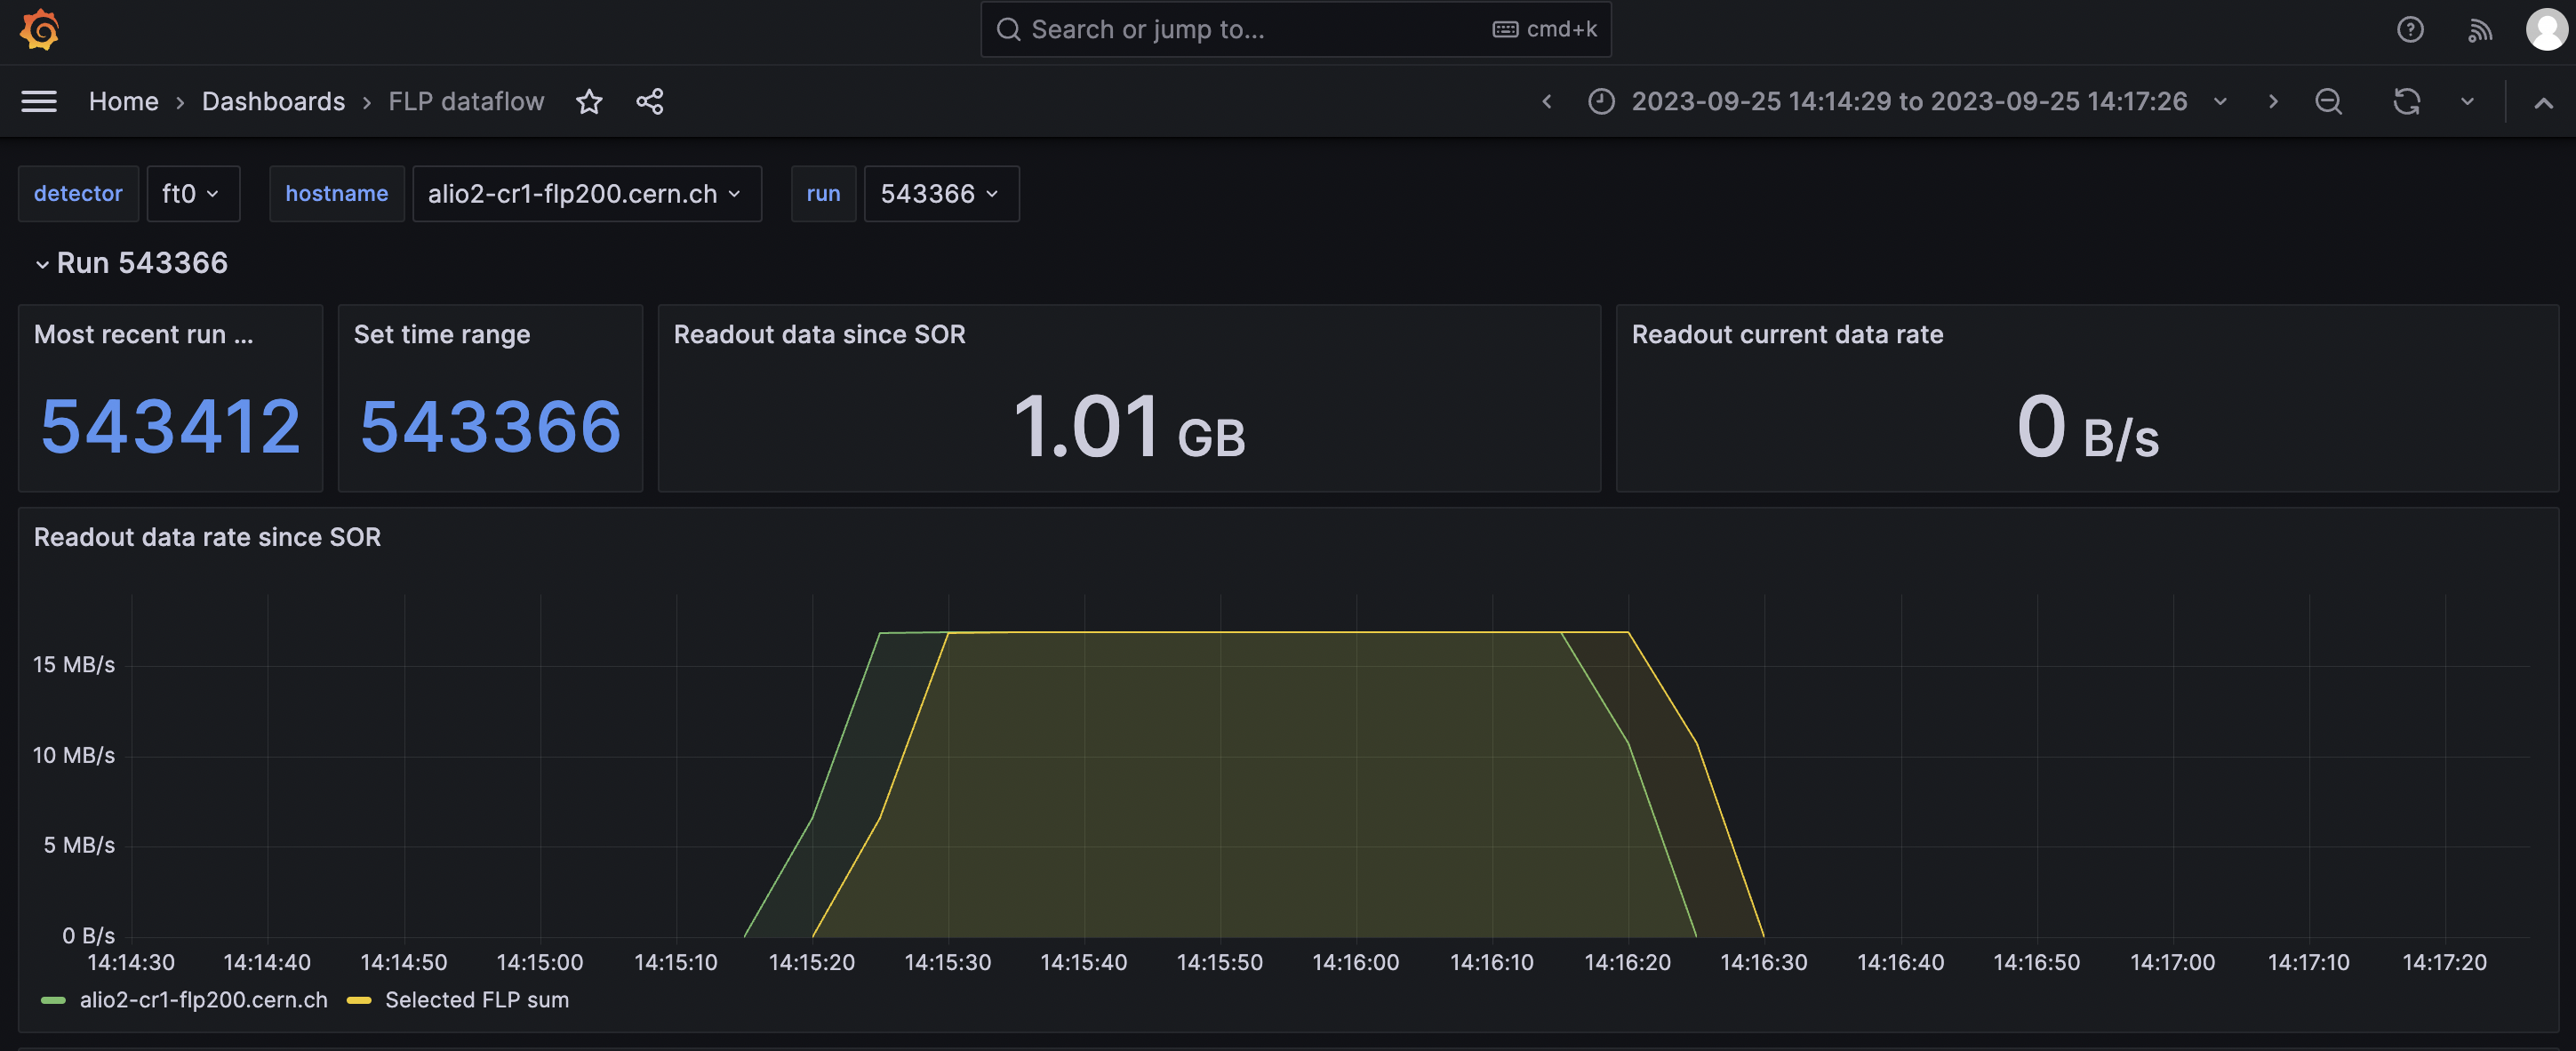 Ask the ECS shifter to check related Grafana plot (example from a laser run shown here)
See: FT0 FLP Dataflow
Ask the ECS shifter to check related Grafana plot (example from a laser run shown here)
See: FT0 FLP Dataflow
Run tagging#
If the readout rate was OK, please set the "Run Quality" to good, and the "Calibration status" to SUCCESS.
If the readout rate was not OK, please set the "Run Quality" to test and the "Calibration status" to FAILED.
ITS: Threshold scan (measurement of average pix thresholds)#
Introduction and general considerations#
The ITS calibration run (threshold scan) is used to verify that the average thresholds of the chips are uniform around 100 electrons. Chip-by-chip thresholds are should in the first series of plots while the other group shows chips which completed the scan.
Check that thresholds are uniform in the dedicated plots: variations for few chips are acceptable. Please call the ITS on-call otherwise. The plots are updated every minute and it's normal if no entries are present after 1-2 minutes.
Expected readout rate#
With the full detector included, the expected readout rate ranges between 10 and 13 GB/s and goes down to about 4 MB/s in the last minute. Fluctuations during the run are totally normal.
Check of CCDB object#
Calibration run ends automatically after 10 minutes. Once ended check that a CCDB object has been pushed to http://alice-ccdb.cern.ch/browse/ITS/Calib/THR. In the metadata, check if the run number is the correct one.
Average threshold plots#
[QC on EPN]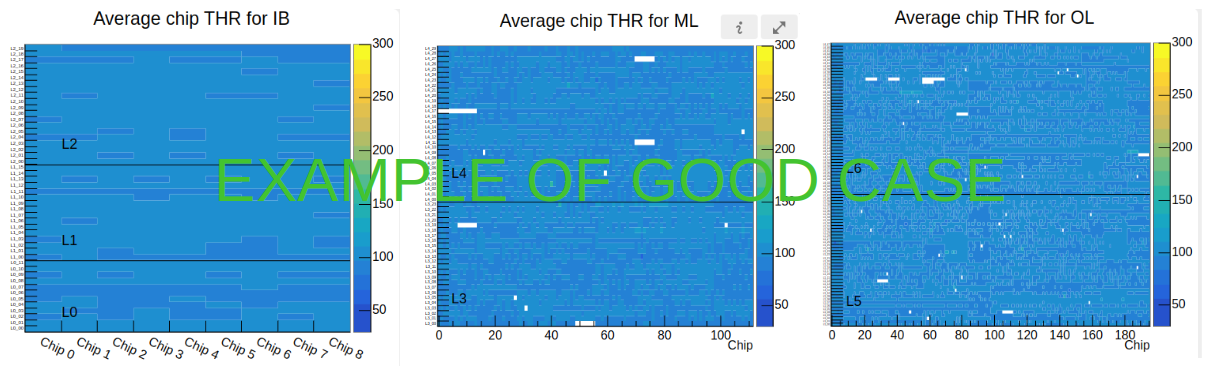
 Known issues
- Typically the lines corresponding to L1_08 and L1_11 are empty (plot for Inner Barrel on the left)
Known issues
- Typically the lines corresponding to L1_08 and L1_11 are empty (plot for Inner Barrel on the left)
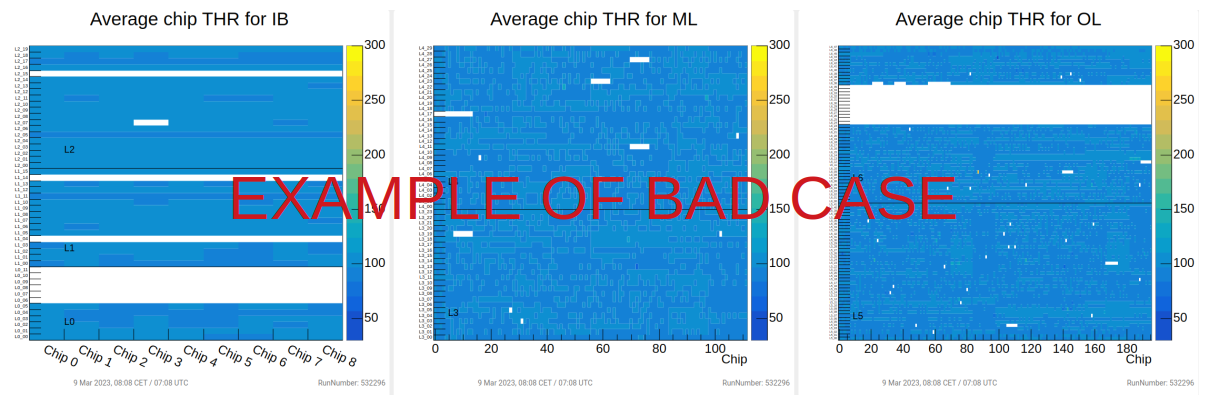
Entries in these plots will appear when stopping the run These plots show the average threshold of every ITS chip. Every bin is a single chip and every line is a single stave as indicated by the y-axis labels. The threshold is in electrons and it's represented by the colored scale. - (left) average threshold of Inner Barrel (Layer 0, 1, 2) - (middle) average threshold of Middle Layers (Layer 3, 4) - (right) average threshold of Outer Layers (Layer 5, 6)
Few empty chips or group of chips are fine (as in the picture). If you get different plots please call the ITS on-call. Example of bad case is also provided: several missing chips.
Plots for completed chips#
[QC on EPN]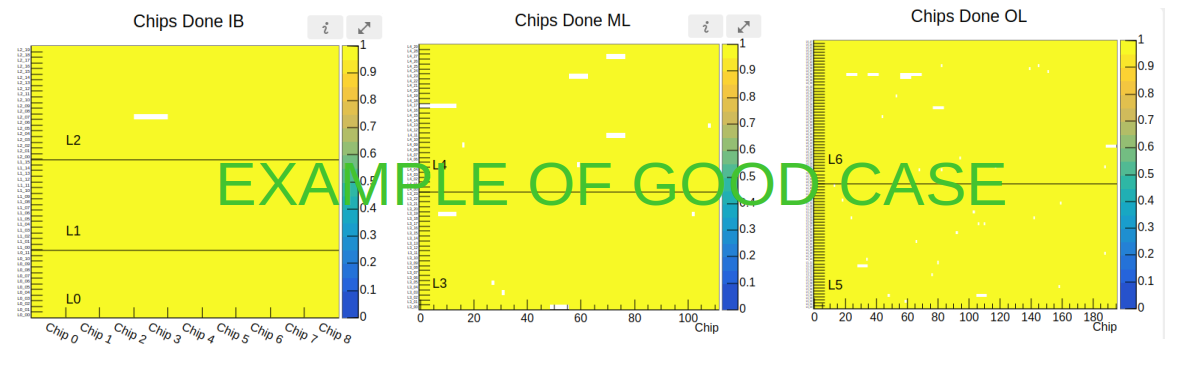
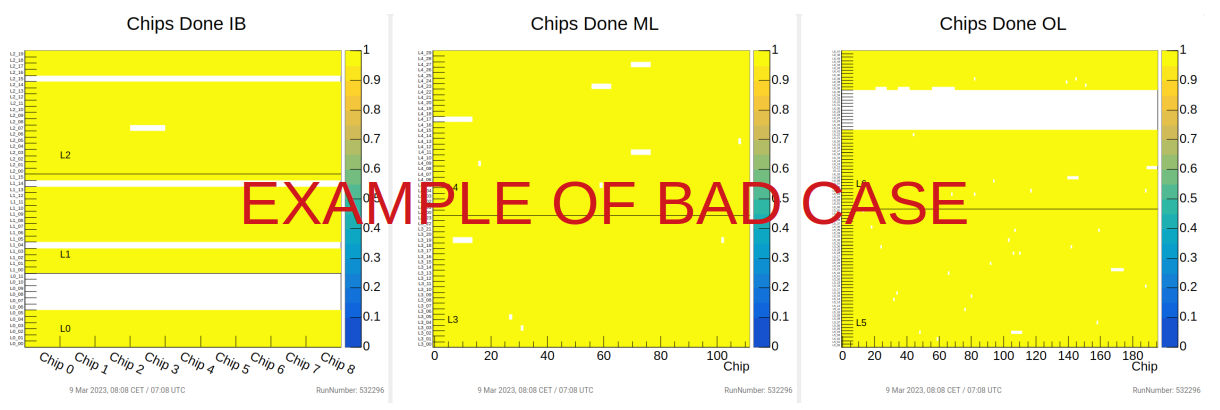
Entries in this plots will appear DURING the run. These plots show the ITS chips for which the calibration scan has been completed. One entry per bin is expected (colored scale). Every bin is a single chip and every line is a single stave as indicated by the y-axis labels. They should have the same amount of bins filled of the previous plots. - (left) Completed chips of Inner Barrel (Layer 0, 1, 2) - (middle) Completed chips of Middle Layers (Layer 3, 4) - (right) Completed chips of Outer Layers (Layer 5, 6)
Few empty chips or group of chips are fine (as in the picture). If you get different plots please call the ITS on-call. Example of bad case is also provided: several missing chips.
MFT#
Noise scan#
Acceptable data rate during the MFT noise scan is 1,95Gb/s +- 10%.
Check the calibration objects#
Check that the calibration objects are correctly uploaded at http://alice-ccdb.cern.ch/browse/MFT/Calib/NoiseMap:
- the most recent object at the top of the page must have a validity start corresponding to the time of the last calibration run and its size must be between 30000 and 60000,
- the run number in the Metadata field on the right of the page must match the one of the last calibration run.
If objects are not produced, inform the SL and ask to re-launch the run. \ If objects are not produced after the second run: notify MFT on-call.
Chips in Warning#
[QC on FLP]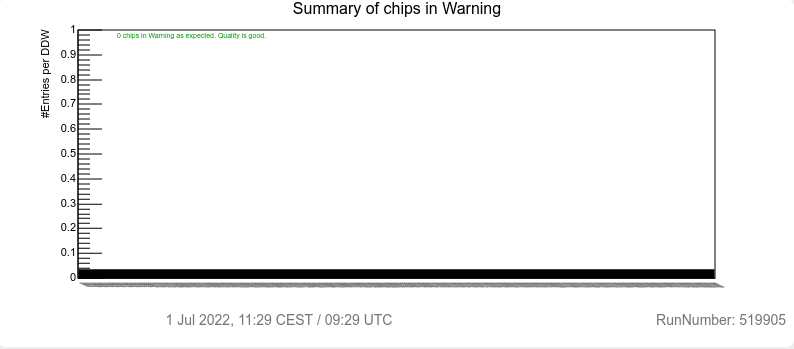
Plot description#
This plot is created on the FLPs. The histogram shows the number of MFT chips in Warning and provides their list up to 20 entries.
Checks to be done#
Check the message on the histogram.
Actions to be taken#
Follow the instructions on the histogram message.
Chips in Error#
[QC on FLP]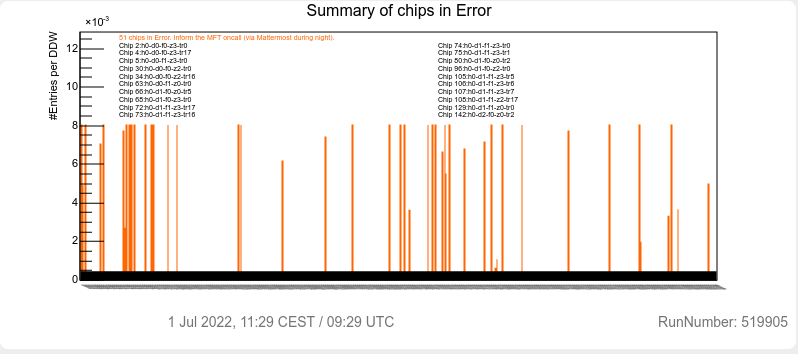
Plot description#
This plot is created on the FLPs. The histogram shows the number of MFT chips in Error and provides their list up to 20 entries.
Checks to be done#
Check the message on the histogram.
Actions to be taken#
Follow the instructions on the histogram message.
Chips in Fault#
[QC on FLP]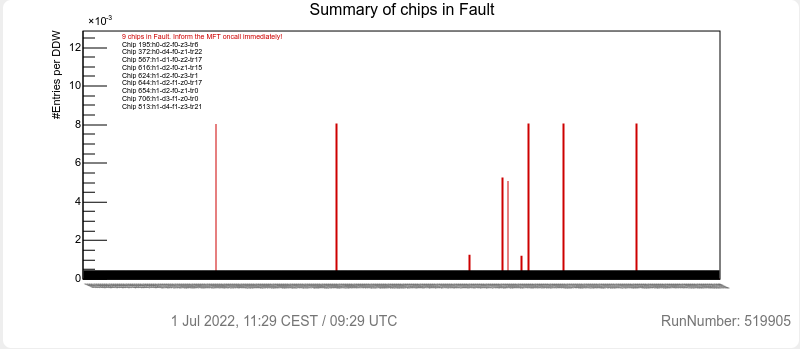
Plot description#
This plot is created on the FLPs. The histogram shows the number of MFT chips in Fault and provides their list up to 20 entries.
Checks to be done#
Check the message on the histogram.
Actions to be taken#
Follow the instructions on the histogram message.
Digit Chip Occupancy#
[QC on FLP]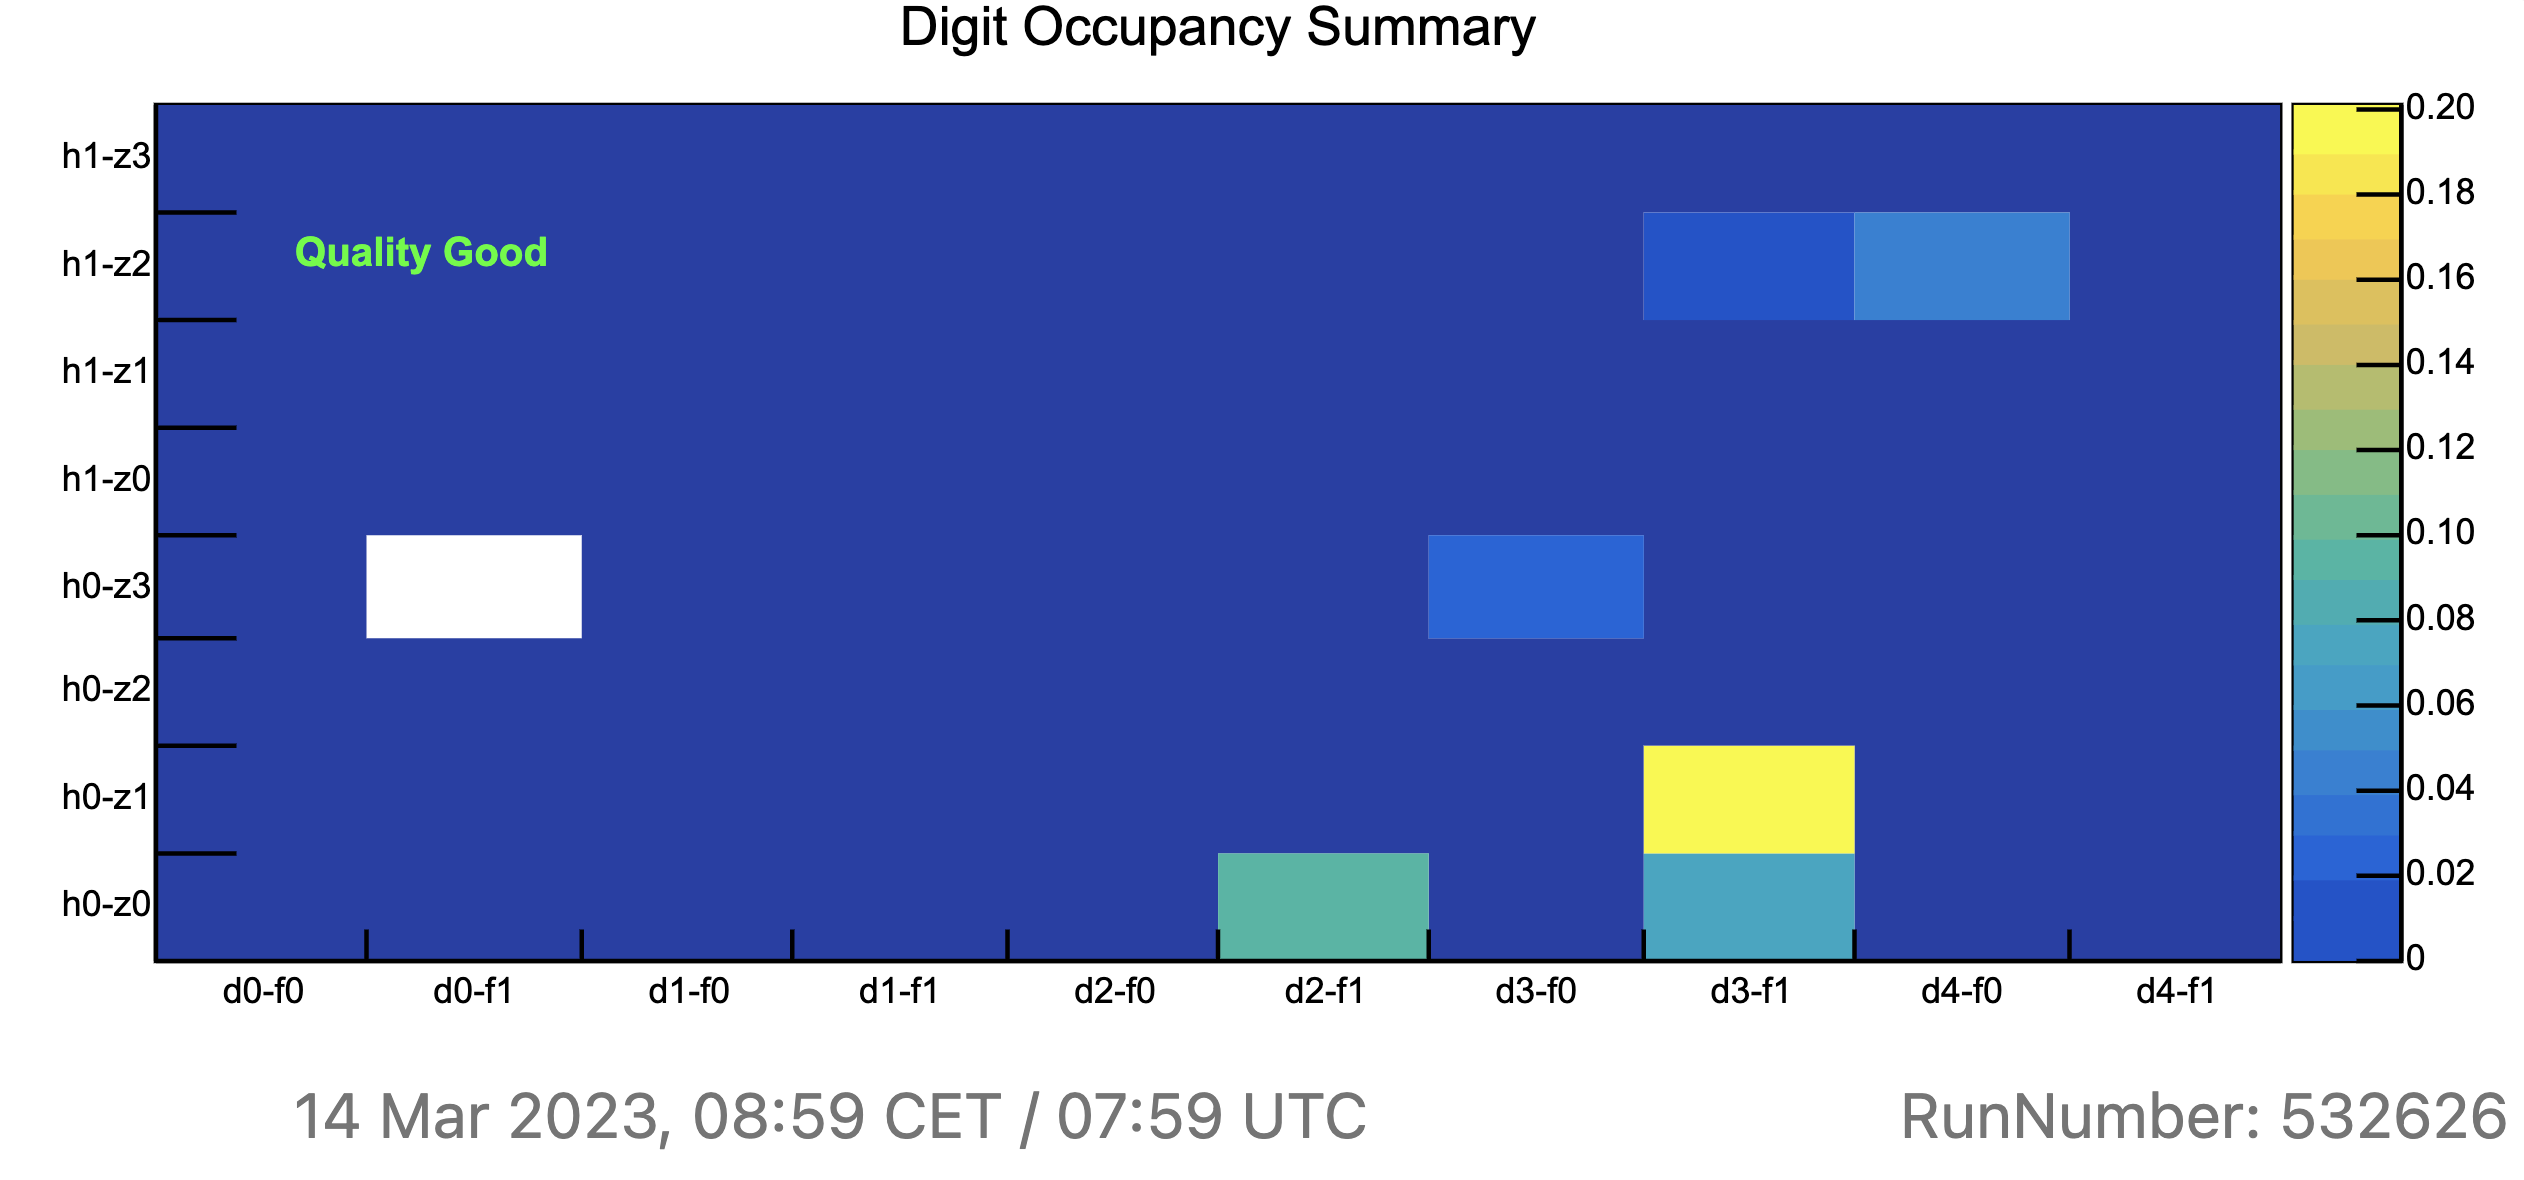
Plot description#
This plot is created on the FLPs. The histogram shows the number of digits per ROF (Readout Frame) per MFT zone.
Checks to be done#
There is an automatic checker for empty zones.
Actions to be taken#
If several MFT zones are empty, the quality is bad (message in red), follow the instructions on the histogram message.
MCH#
Check the calibration objects#
Check that the calibration objects are correctly uploaded at http://alice-ccdb.cern.ch/browse/MCH/Calib/BadChannel:
- the most recent object at the top of the page must have a validity start corresponding to the time of the last calibration run
- the run number in the Metadata field on the right of the page must match the one of the last calibration run
If objects are not produced, inform the SL and ask to re-launch the run.\ If objects are not produced after the second run: notify MCH on-call.
Check the QC plots#
[QC on EPN]
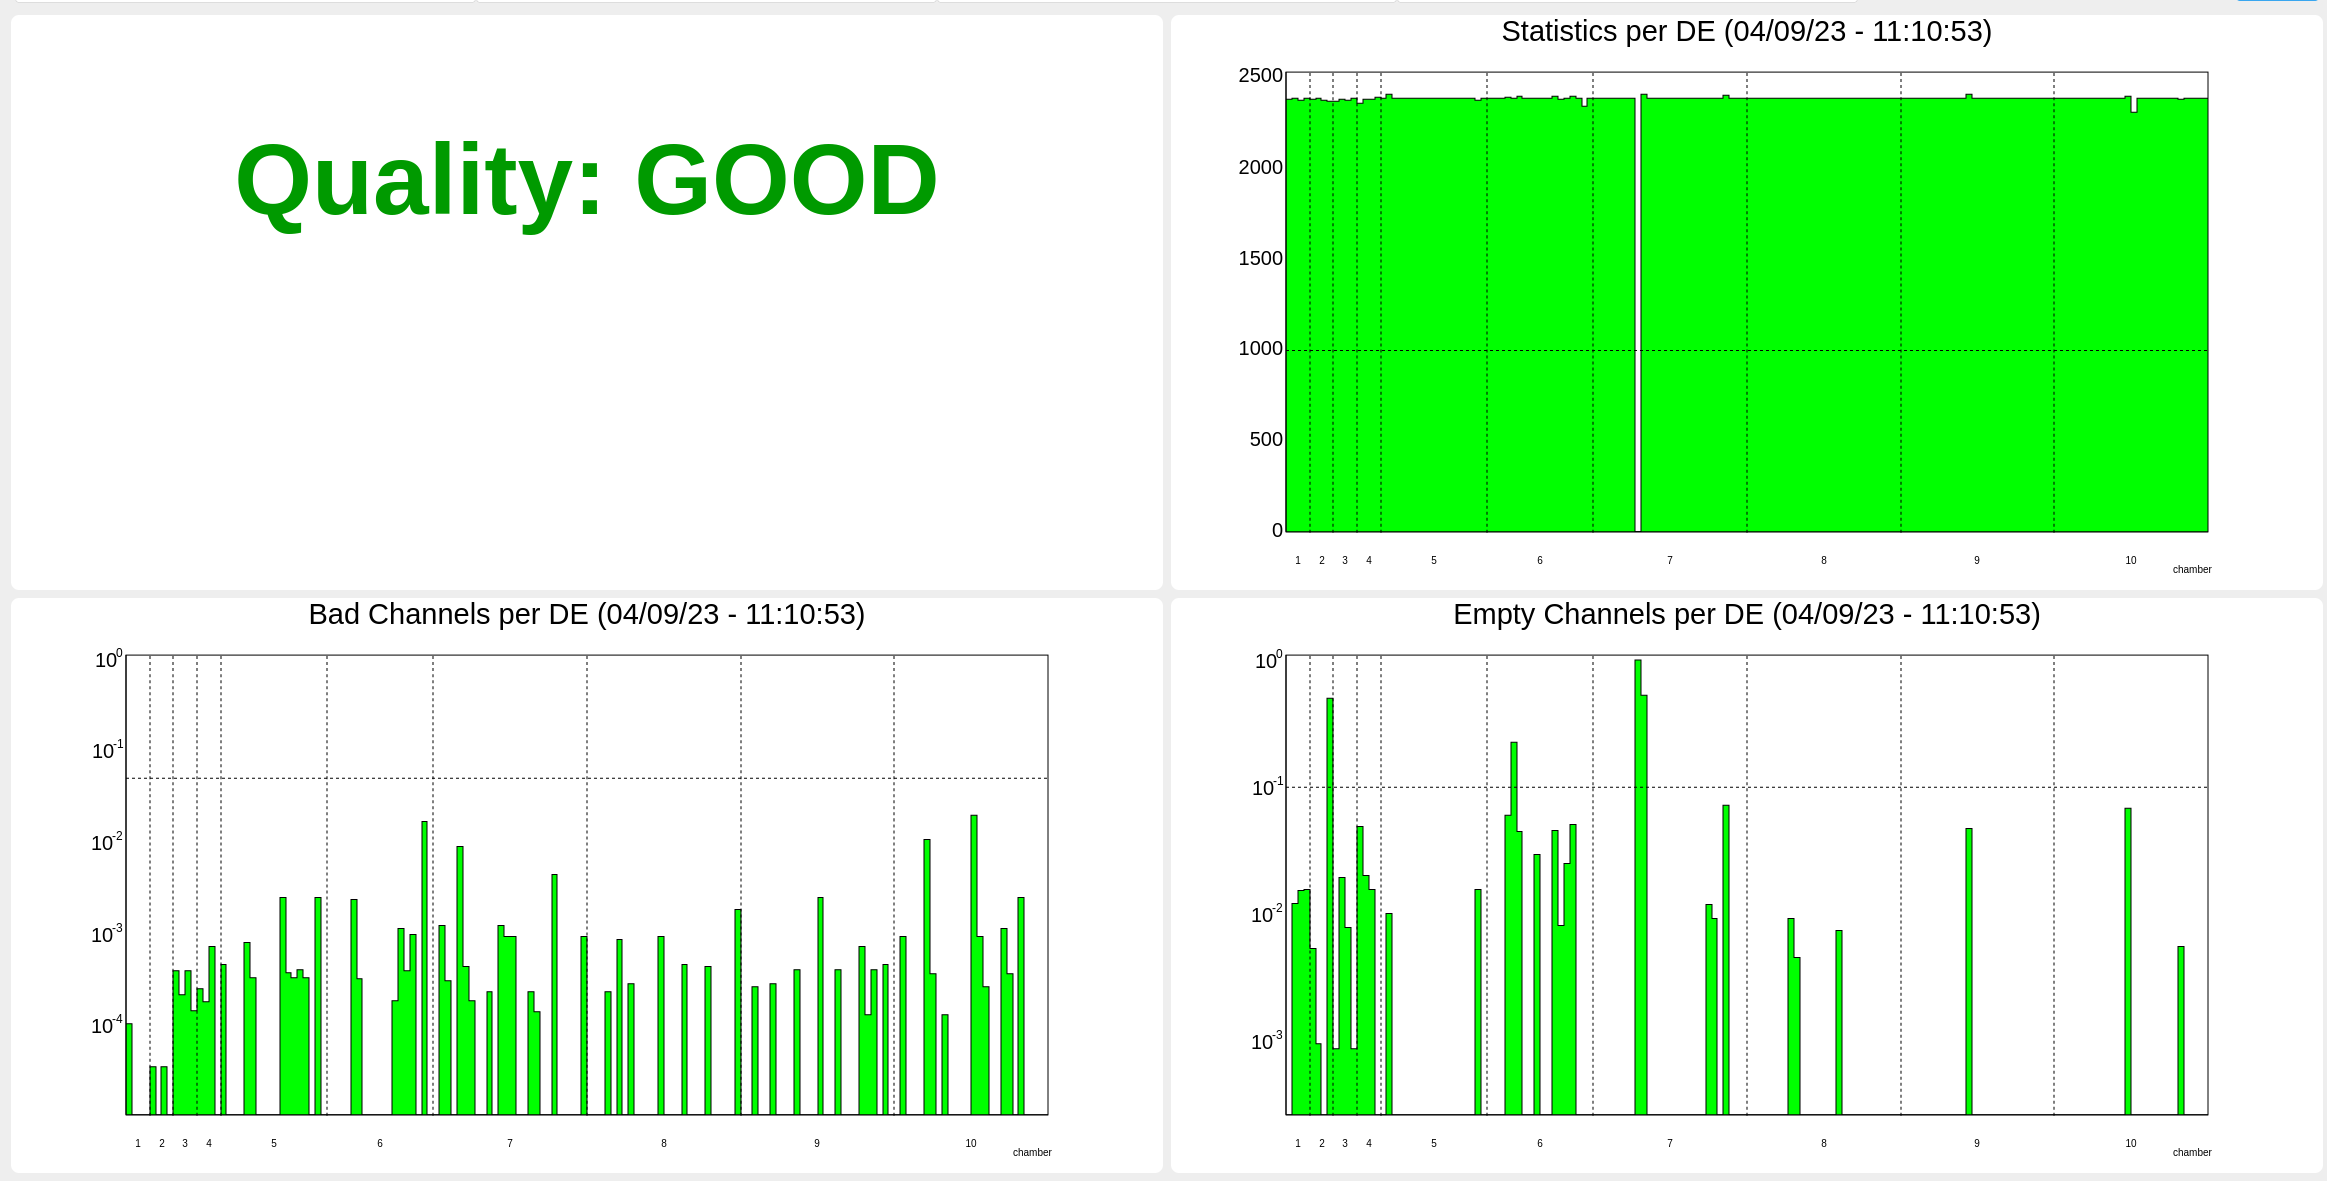
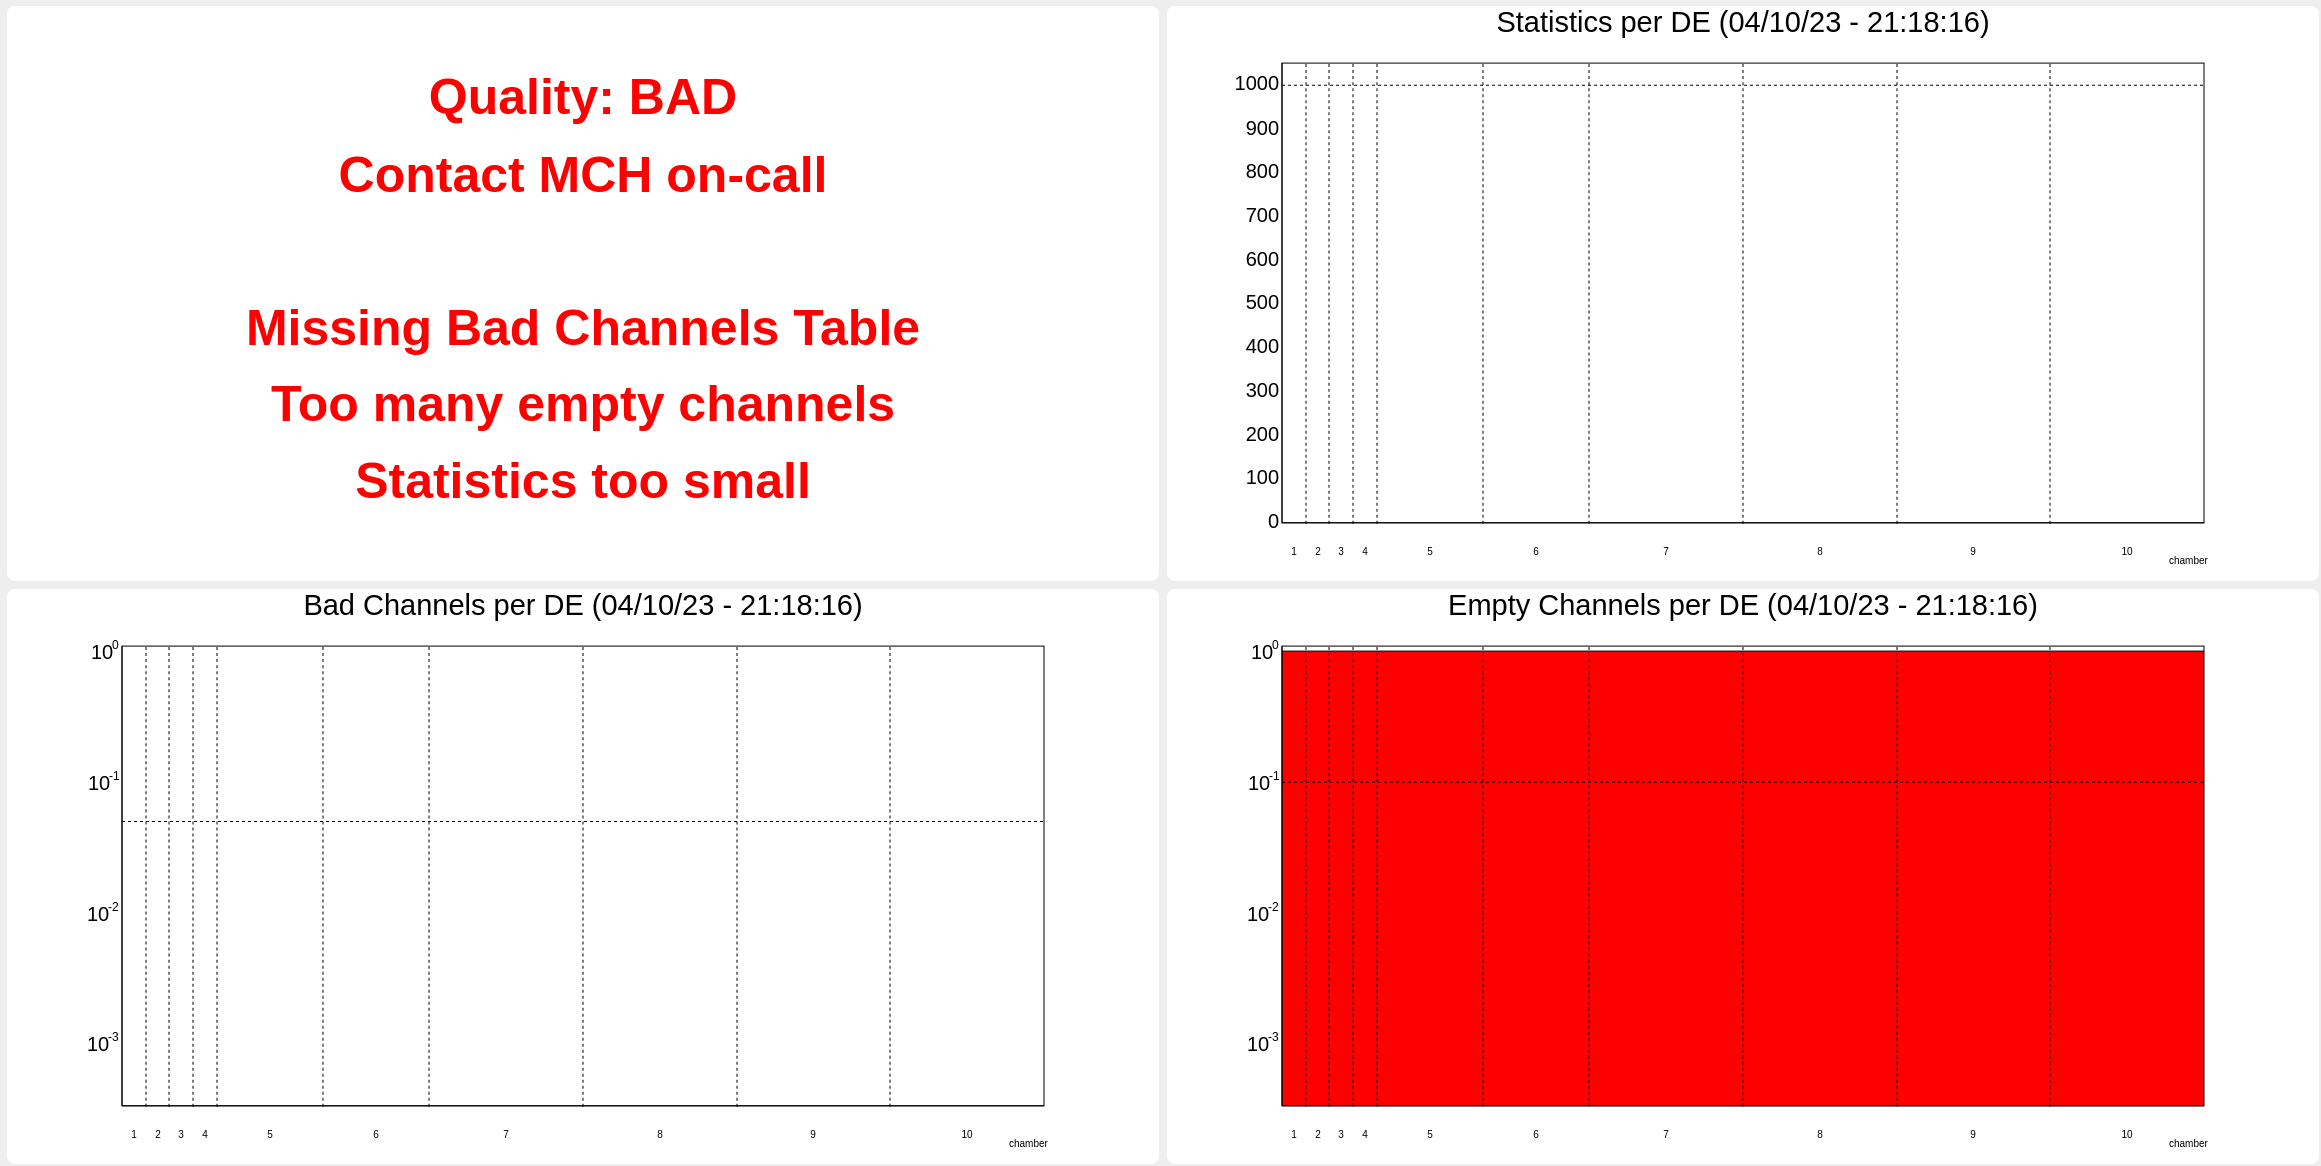
The plots show the statistics per each detection element (i.e. each station of the MCH), the bad channels per detection element and the empty channels per detection element. The plots are updated only once the calibration run is stopped.\ A message box on the top left shows the result of the automatic check of the histogram values.
If any significant deviation from the expected values is detected, the box will show a red background and will instruct the shifter to notify MCH on-call.
MID#
Bad channels ::#
Typical Data Rate: 40-45 MB/s
Run duration: 2 minutes
DCS state: READY
The plots are showing the MID bad (i.e. dead or noisy) channels. Check that the calibration objets are produced:
[QC on EPN]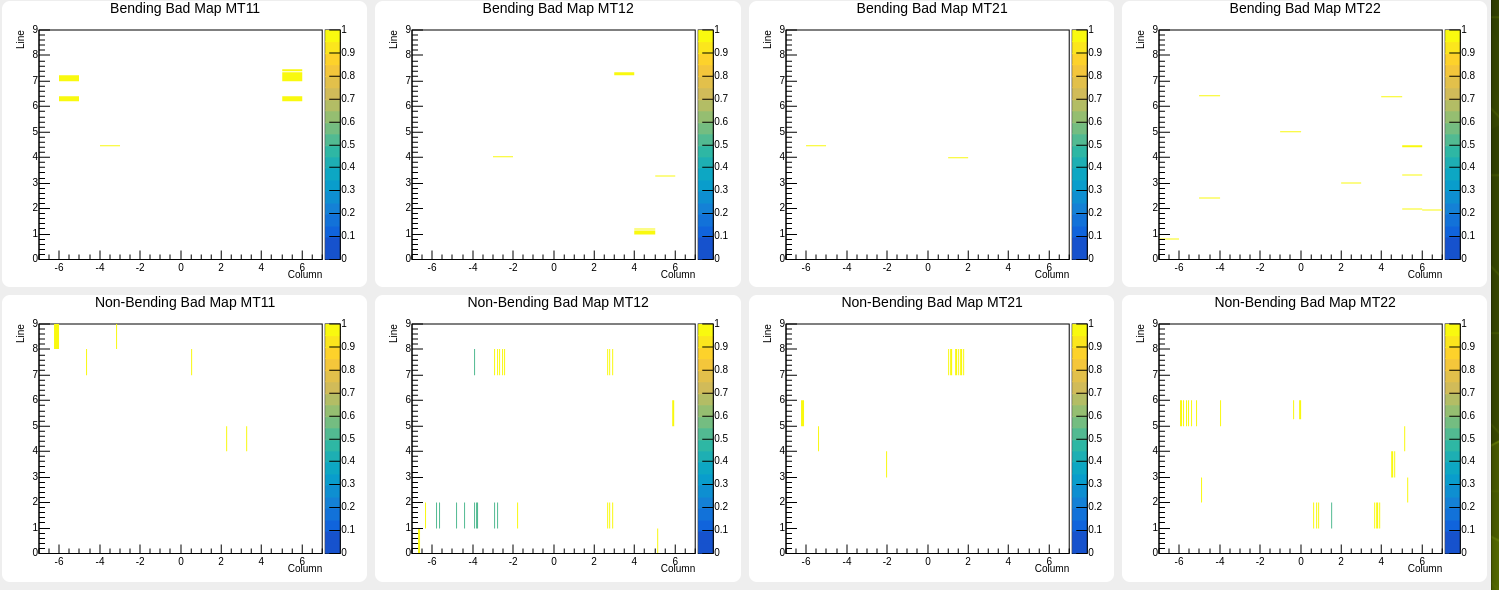
If histograms are empty, inform the SL and ask to re-launch the run. If histograms are empty after the second run: notify MID on-call.
NOTE: plots are only filled when the End-of-Stream is received. This means that the QC shifter must wait until the end of the run before checking the plots.
Check also (at the end of the run) that the CCDB entry is there: http://alice-ccdb.cern.ch/browse/MID/Calib/BadChannels
TPC#
General instruction:#
The following issue are know an can be ignored:
- Fatal error: "Number pf Pads 72. Should not be more then 1"
- Error: "Dropping < matcher query: (and origin: TPC) ...>"
- Error: "M_range_check: __n (which is 0) >= this->size() (which is 0)"
TPC_CalibPulser#
[QC on EPN] During the Pulser calibration a signal is induced to all readout pads of the TPC via a Pulser connected to the GEM electrode which is closest to the pad plane. The purpose is to monitor the timing of the readout and the pad response (e.g. check for dead pads)
Typical Data Rate: 7-10 GB/s
Run duration: 20 seconds
CCDB Object: - http://alice-ccdb.cern.ch/browse/TPC/Calib/Pulser - Typical size: 3100000 - 330000
DCS state: BEAM_Tuning
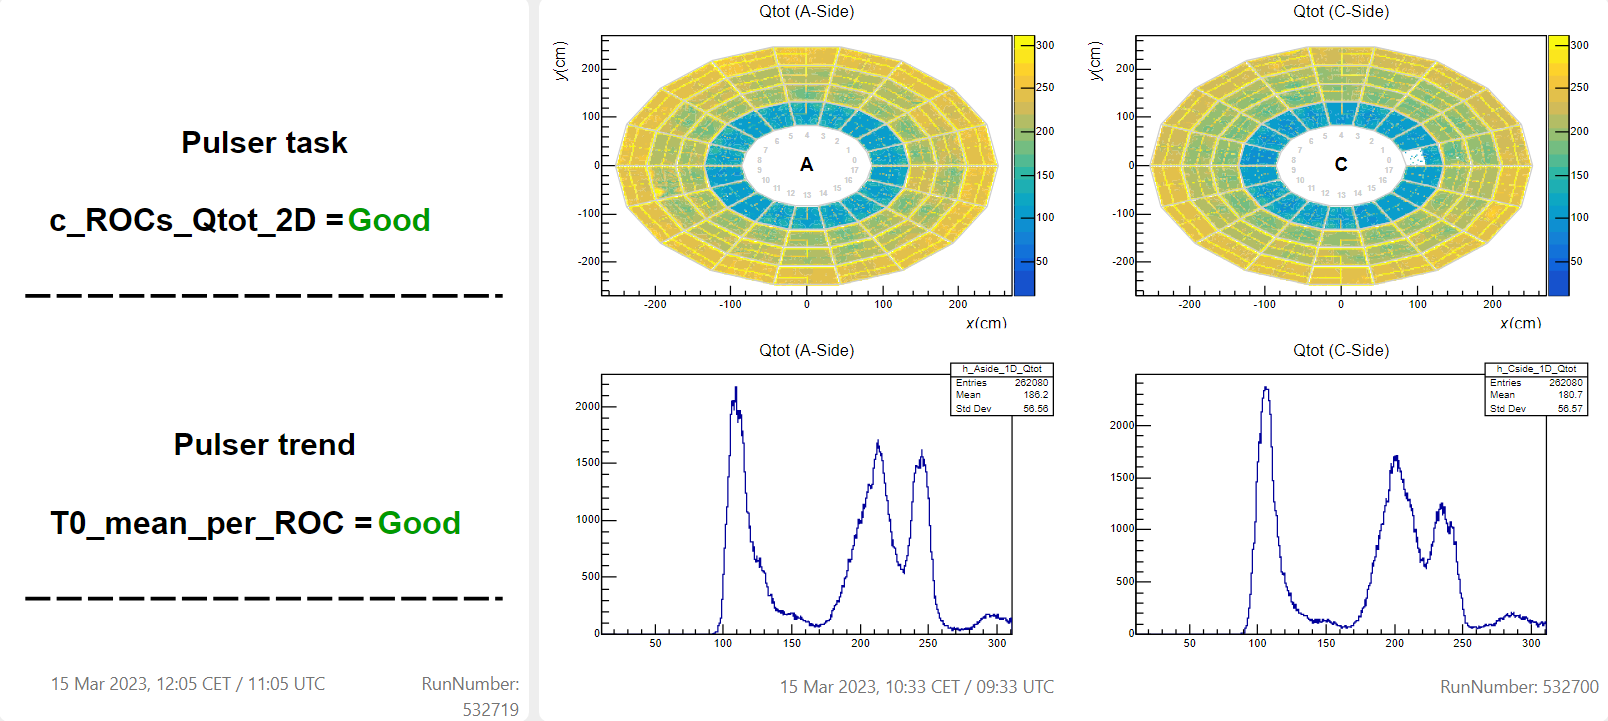
The Quality Observer give the summary of quality checkers for a Pulser run. The checkers are on the Pulser timing trend and on empty region in the 2D plot. All value should be "Good" The plot shows Qtot for the pulser signal on A and C side. The plot/summary table are updated after a Pulser calibration run.
In one of the following cases put an log entry: - Plot/summary table are not updated - Quality is not "Good" - Different pattern of 2D plot then example
TPC_CalibLaser#
[QC on EPN] During the Laser calibration a signal from a calibration laser is being shot radially into the TPC at differnet z and phi positions. By this straight tracks are created in the active volume which are reconstructed. Additionally the light of laser knocks out electrons for the central electrode. The information of the tracks and the electrons from the central electrode are used to determine the drift velocity.
Typical Data Rate: 2-5 GB/s
Run duration: 2 minutes
CCDB Object 1: - http://alice-ccdb.cern.ch/browse/TPC/Calib/CE - Typical size: 1700000 - 1800000
CCDB Object 2: - http://alice-ccdb.cern.ch/browse/TPC/Calib/LaserTracks - Typical size: 40000 - 45000 -
DCS state: READY
 The Quality Observer give the summary of quality checkers for a Laser run.
The checkers are on the drift velocity and the drift time trend.
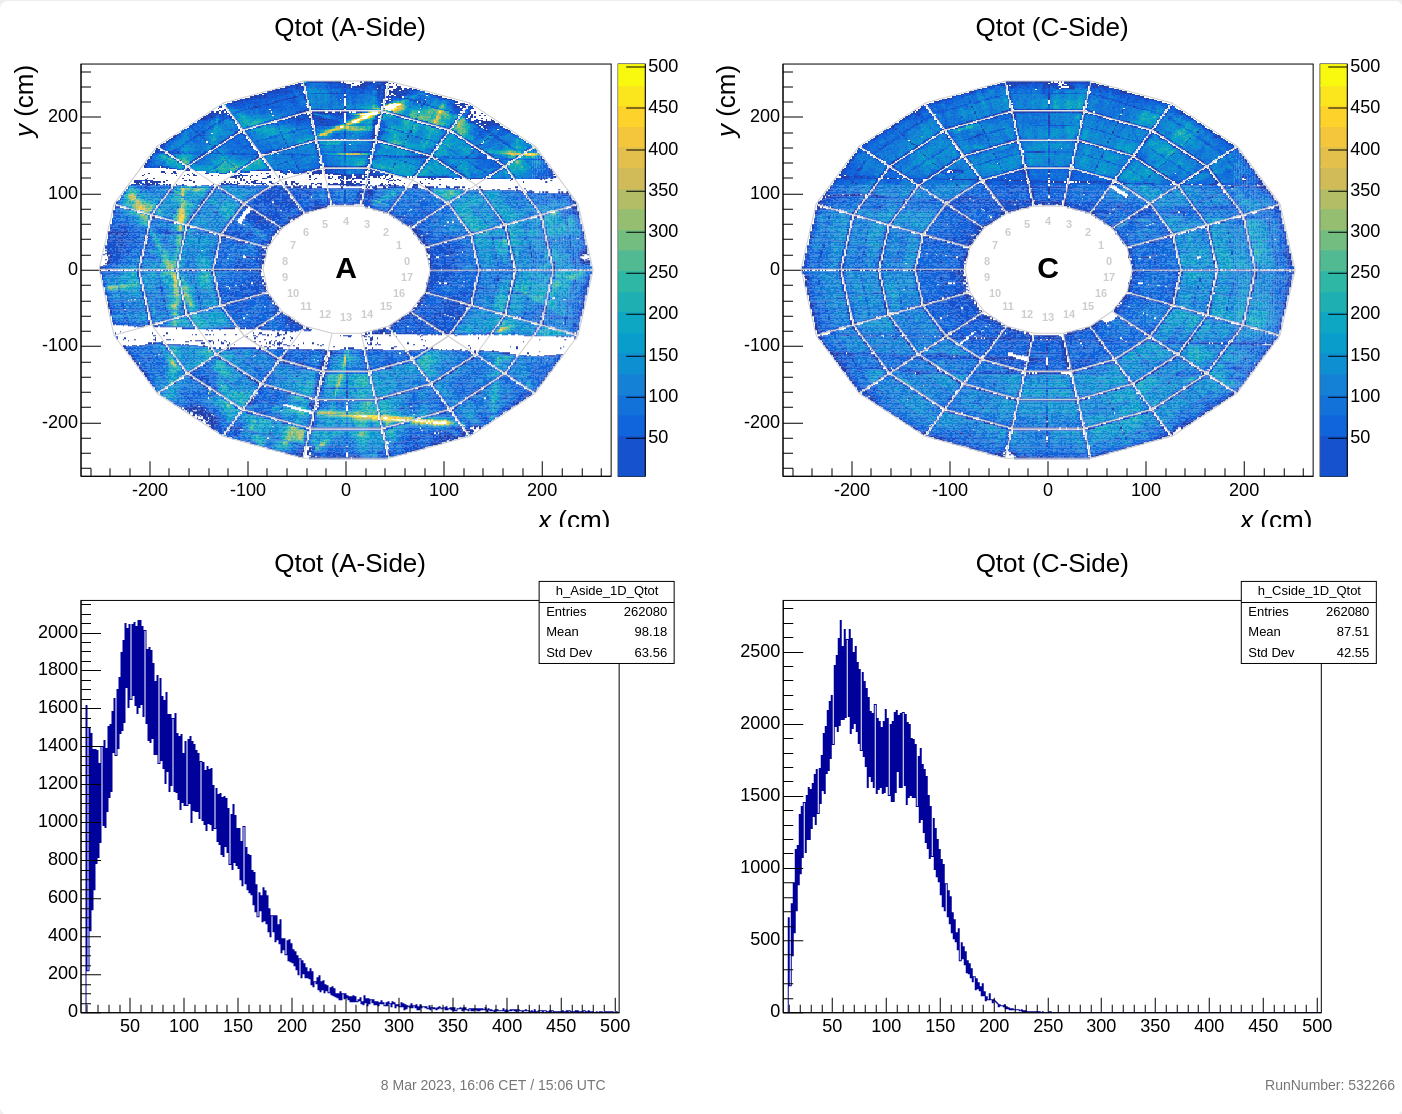
The plot shows Qtot for the laser signal from the Central Electrode on A and C side.
The two empty horizontal empty bands are expected.
The plot/summary table are updated after a Laser calibration run.
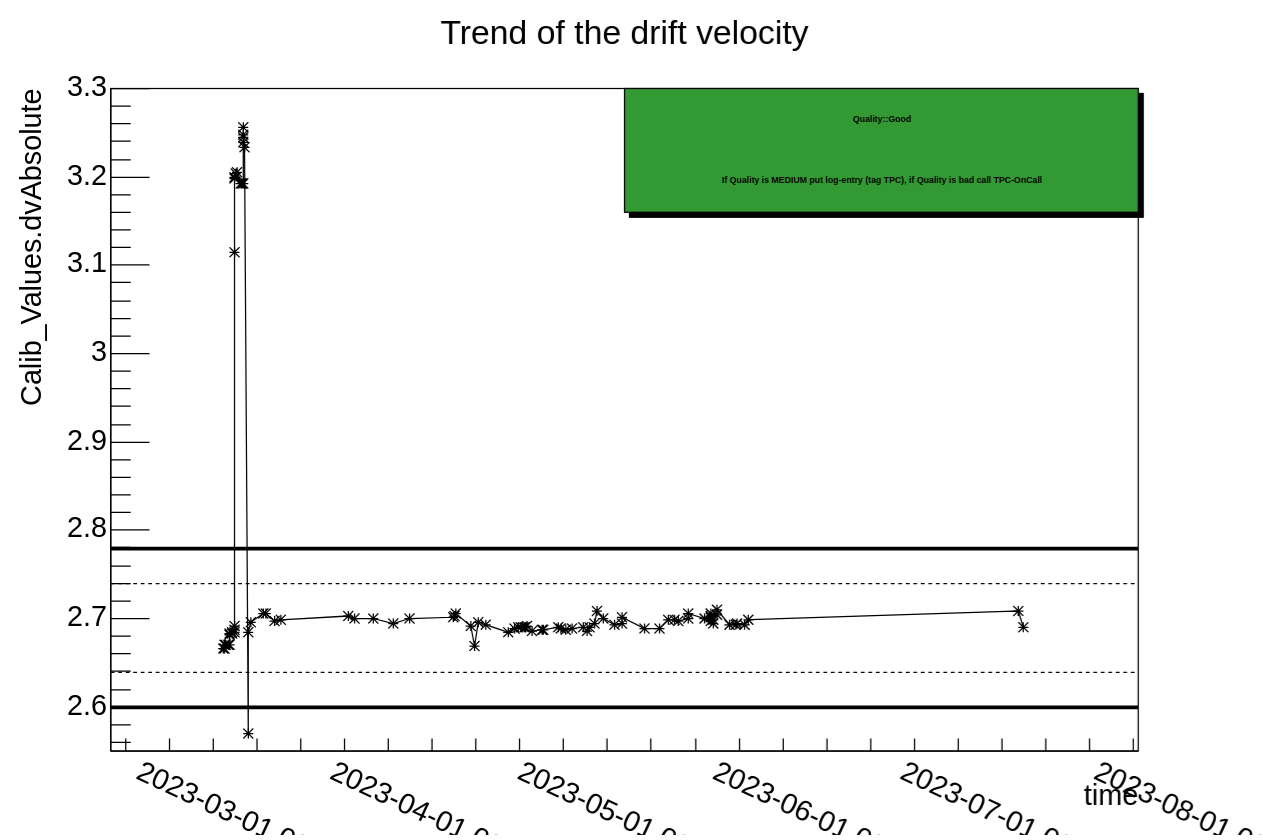
The trend plot tracks the evalution of the obtained vDrift value.
The Quality Observer give the summary of quality checkers for a Laser run.
The checkers are on the drift velocity and the drift time trend.
The plot shows Qtot for the laser signal from the Central Electrode on A and C side.
The two empty horizontal empty bands are expected.
The plot/summary table are updated after a Laser calibration run.
The trend plot tracks the evalution of the obtained vDrift value.
In one of the following cases put an log entry:
- Plot/summary table are not updated
- Quality is not "Good"
- Different pattern of 2D plot then example
- No new point in the trend plot after the calibration.
- New point in trend plot outside the expected range.
**Known Issue
- Production of 2D failed occasionally. If 2D plots are empty run be declared good as long as vdrift Trend is updated with GOOD quality
- Run might end in ERROR. Can be ignored if vdrift Trend is updated with GOOD quality
TPC_CalibPedestal#
[QC on EPN] During the Pedestal calibration the zero supression is disabled and the offset and the noise is measured. The value are used as an input for the zero supression.
Typical Data Rate: ~155 GB/s
Run duration: 20 seconds
CCDB Object:
- http://alice-ccdb.cern.ch/browse/TPC/Calib/PedestalNoise
- Typical size: 3400000 - 350000
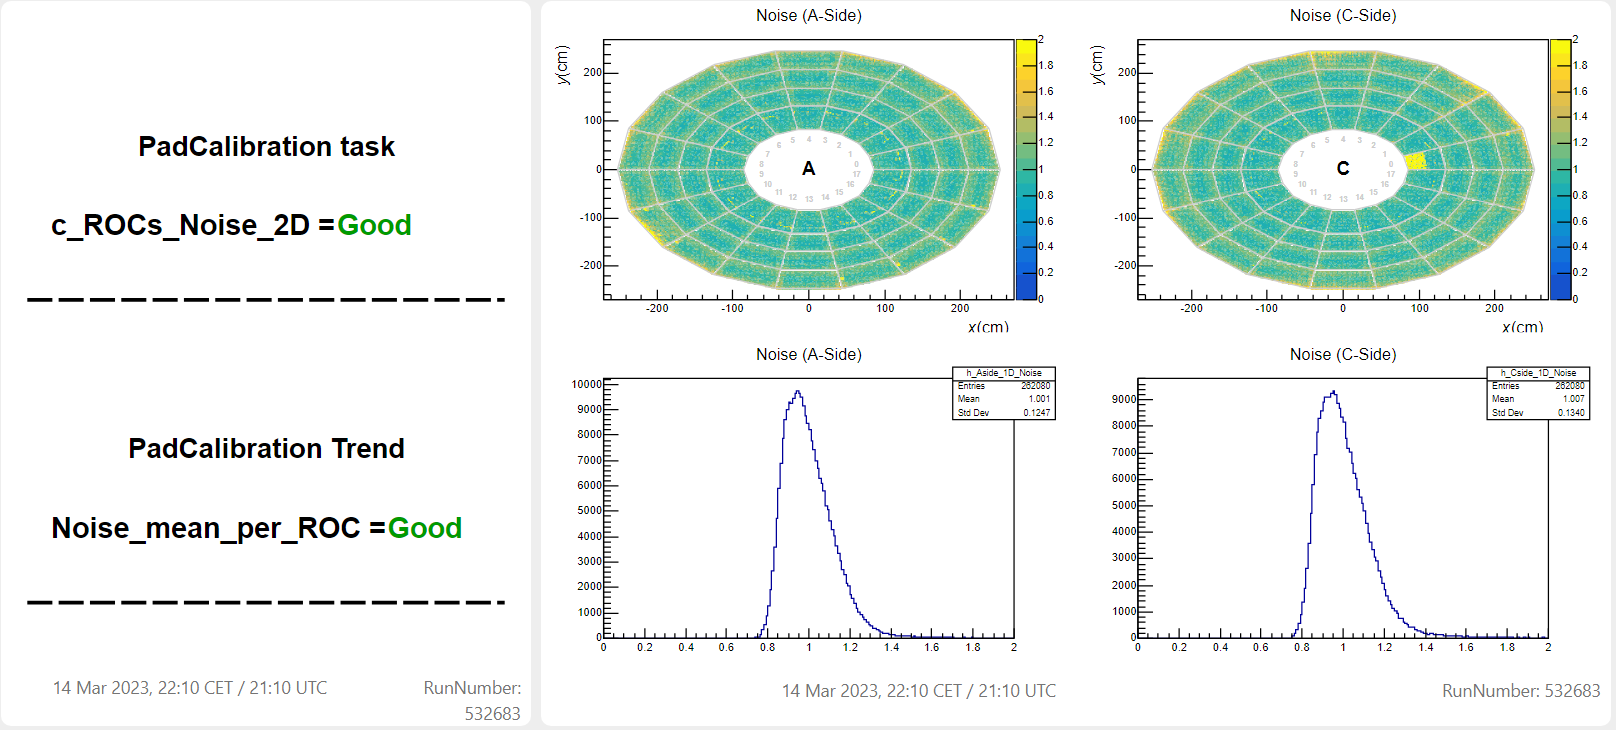 The Quality Observer give the summary of quality checkers for a Pedestal run.
The checkers are on the Noise trend and on empty region in the 2D plot.
The plots shows Noise measured for each Pad on A and C side.
The plot/summary table are updated after a Pedestal calibration run.
The Quality Observer give the summary of quality checkers for a Pedestal run.
The checkers are on the Noise trend and on empty region in the 2D plot.
The plots shows Noise measured for each Pad on A and C side.
The plot/summary table are updated after a Pedestal calibration run.
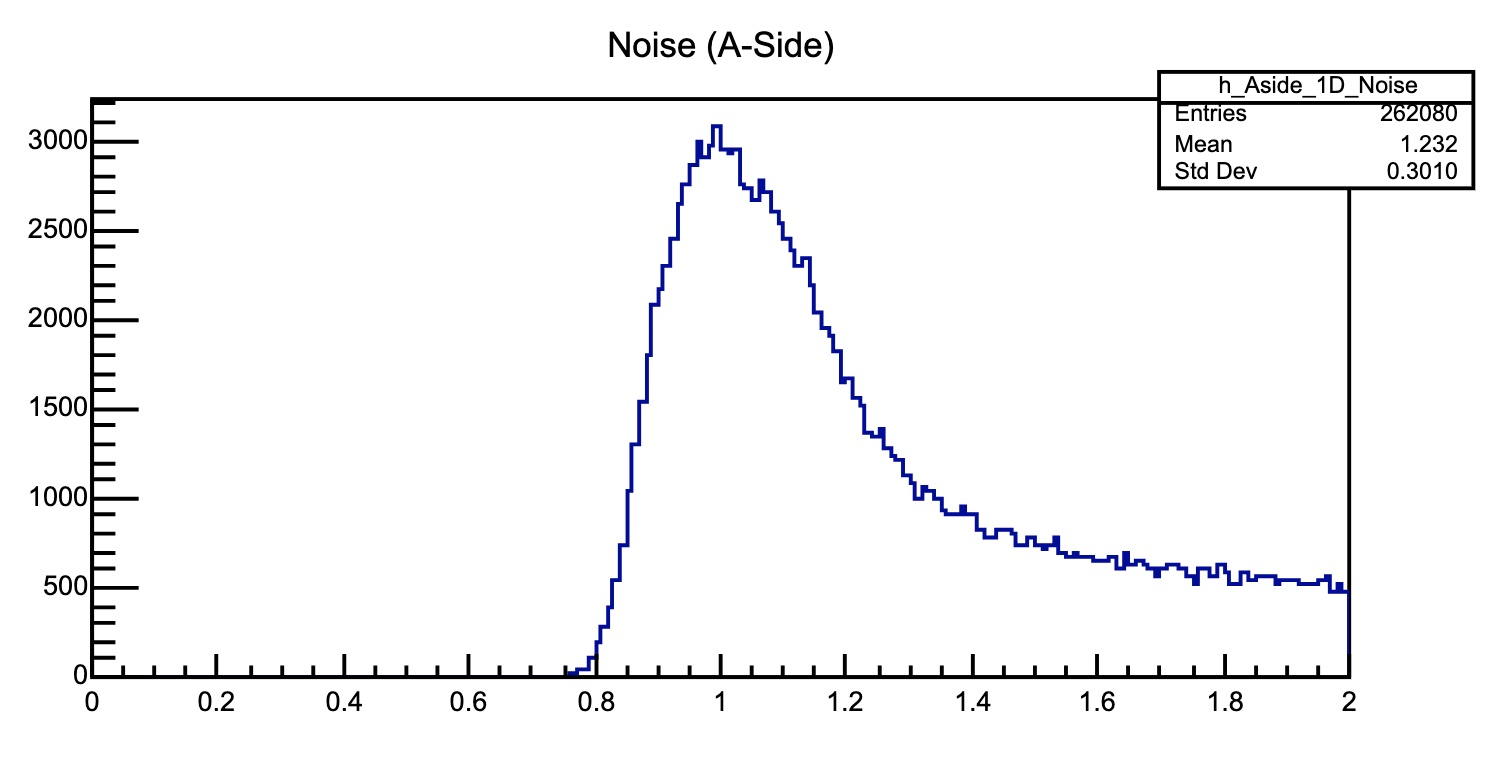
If one or both the 1-D noise distributions look like the picture below (large tail with several entries above 1.6), the pedestal run is not good and must be repeated.
--> In one of the following cases put an log entry:
- Plot/summary table are not updated
- Quality is not "Good"
- Different pattern of 2D plot then example
ZDC#
Usually ZDC calibration runs are done once per fill (in the second half of the ramp phase). This run lasts 3 min, the QC plots will update 3 times, only the last ones, at the end of the run, are relevant for the quality. Please check if run number on the plots corresponds to last CALIBRATION_ZDC run.
- Typical Data Rate: 79 MB/s
- Run duration: 3 minutes
- DCS state: SS
This run will not create any object in the CCDB.
If any plot displays an error, try running the calibration procedure a second time before calling the on-call.
Alignment#
[QC on FLP]
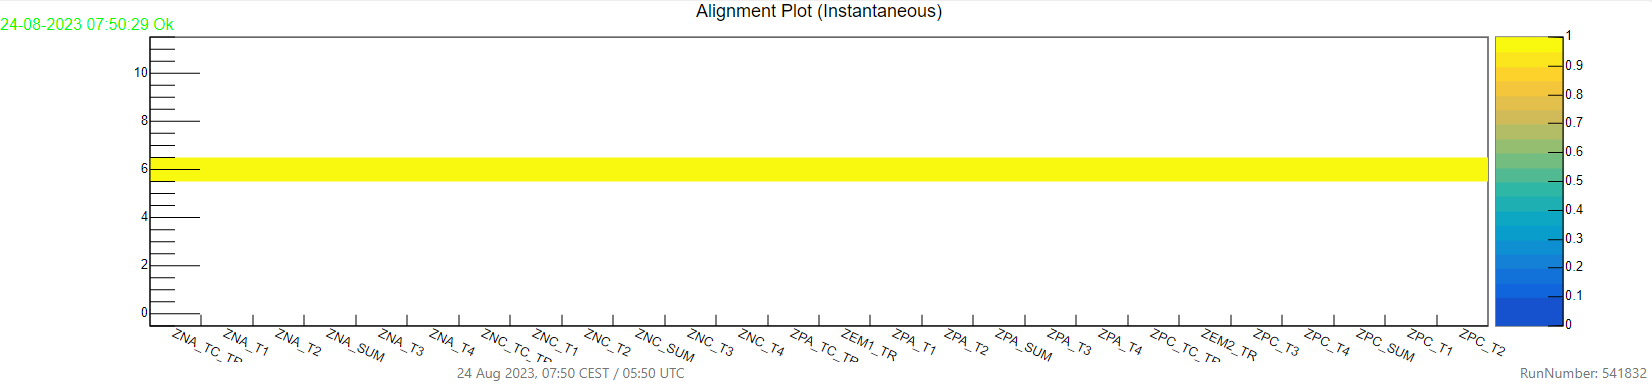
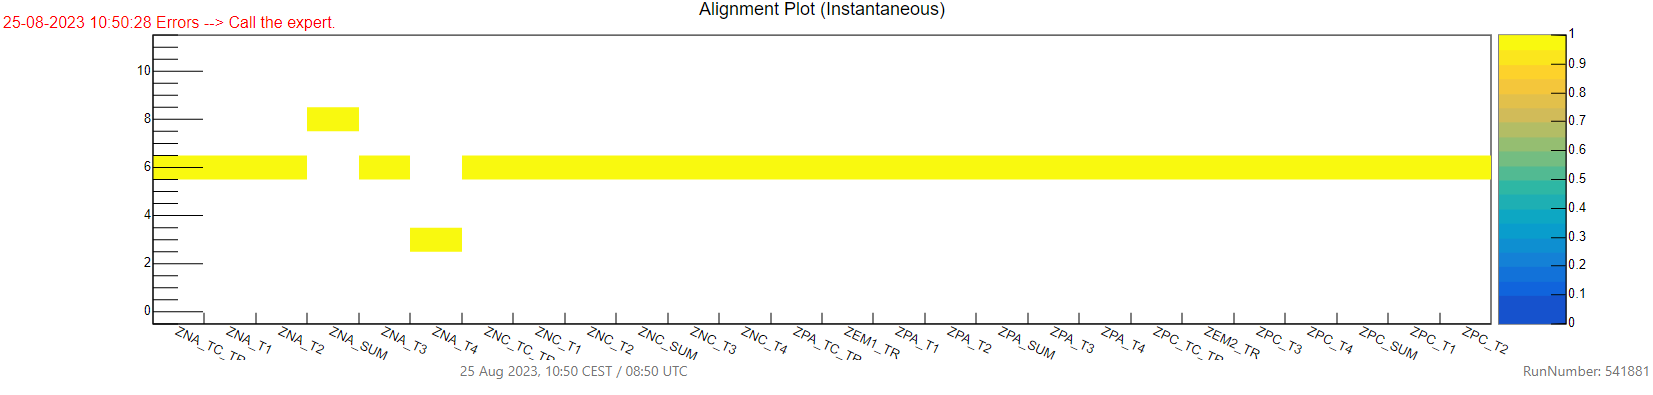
A plot related to a good calibration will have every channel aligned to sample 6 like in the picture. Otherwise it will be considered bad, as in the picture below.
If at the end of the run this plot is empty or shows an error, please call the on-call.
Please remember that this plot must not have empty channels, the only good output is the one in the picture.
Below is an example of bad plot.
Baseline Summary#
[QC on FLP]
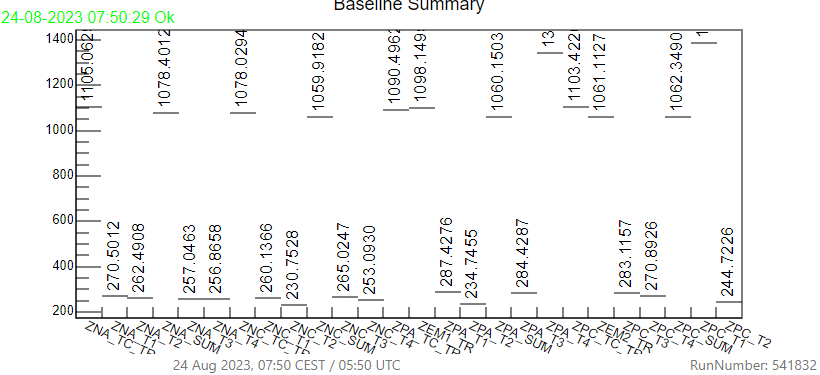
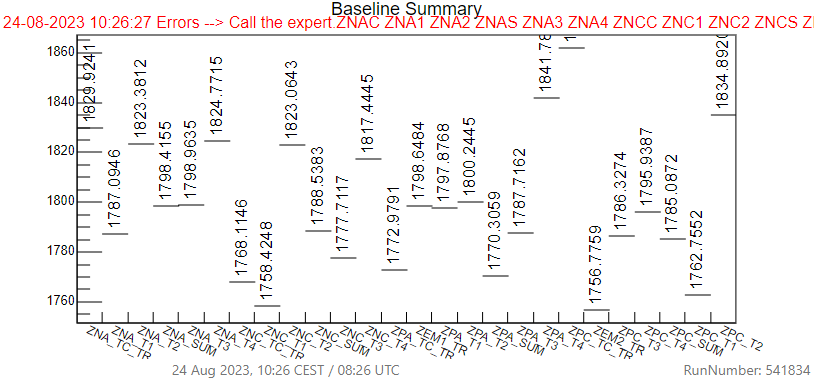
This plot is self-checking, just look if the run number is correct and the status is OK as in the picture above.
If at the end of the run this plot is empty or shows an error, please call the on-call. Below is an example of bad plot.
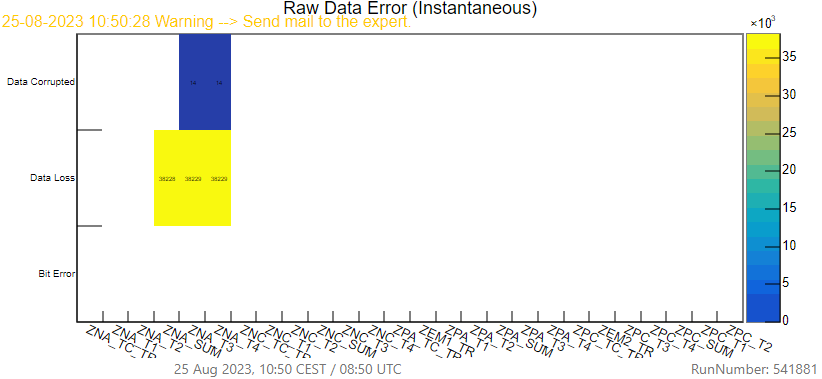
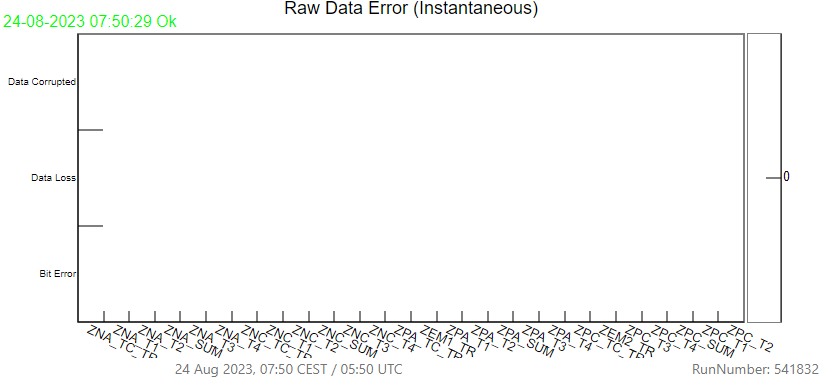
Raw Data Error#
[QC on FLP] This plot should always be empty, if at the end of the run there are entries please call the on-call. Please remember to check the run number at each run.
Example of good plot:
Example of bad plot: