MCH#
Quality Summary#
[QC on EPN]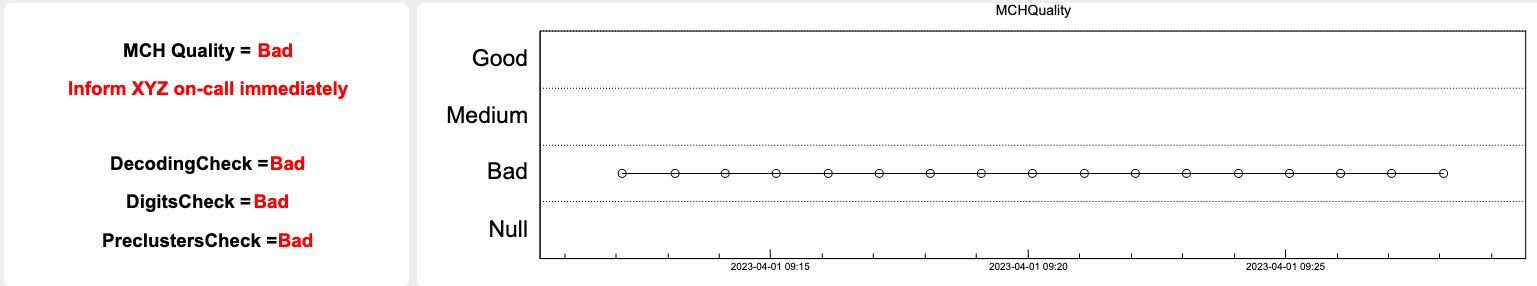
The left panel show a summary of the automated checked on the MCH data, in a human-readable format. The top line describes the aggregated quality status, followed by a message suggesting the appropriate action according to the quality level: * Bad: immediately inform the MCH on-call * Medium: write a logbook entry, tagging MCH * Null: the plots are completely empty. Check in DCS if MCH is in STANBY. If not, inform the MCH on-call.
The right panel shows a trending plot of the aggregated quality. The message in the left panel always corresponds to the most recent point in the trending plot.
If the quality in the trend plot is Bad for the whole duration of a run, MCH should be marked as Bad in the Bookkeeping flags for the run.
Quality Plots#
The following plots show the distribution of various estimators of the MCH data quality. Each horizontal bin shows the value of the monitored quantity, averaged over one Detection Element(DE). The vertical dashed lines show the boundaries between each of the 10 MCH chambers. An horizontal dashed line shows the threshold used by the checker to decide if a given detection element is considered good or bad.
The checker assigns an overall Good (green), Medium (orange) or Bad (red) quality flag to the plot, depending on the number and pattern of bad DEs. In general, the quality is still considered Good if only few DEs are bad. The quality is set to Medium if several DEs are Bad, but no significant impact on the detector acceptance is expected. If the number and pattern of bad DEs is such that the acceptance will be degraded, the quality is set to Bad.
The overall aggregated MCH quality is the logic AND of the qualities of the individual plots.
Fraction of Synchronized Boards#
[QC on EPN]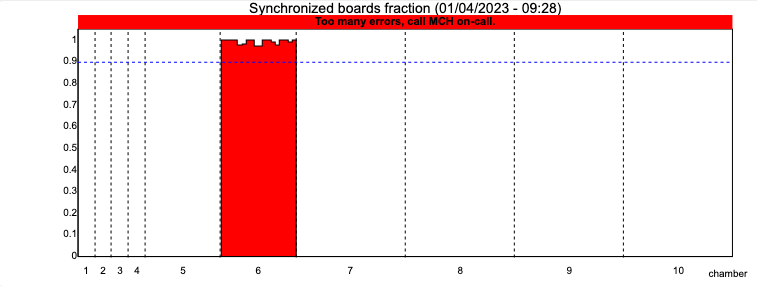
The plot shows, for each Detection Element, the fraction of FEC boards that are properly synchronized. A given DE is coinsidered bad if the corresponding fraction is below the horizontal dashed line.
Fraction of Boards not in Error#
[QC on EPN]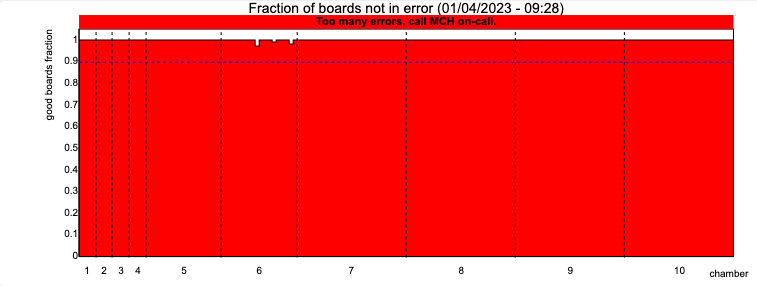
The plot shows, for each Detection Element, the fraction of FEC boards that do not have decoding errors. A given DE is coinsidered bad if the corresponding fraction is below the horizontal dashed line.
Fraction of Boards with Good Rate#
[QC on EPN]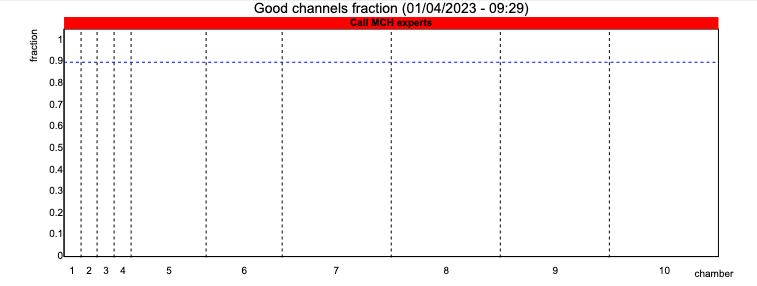
The plot shows, for each Detection Element, the fraction of FEC boards that have a correct hit rate. A given DE is coinsidered bad if the corresponding fraction is below the horizontal dashed line.
Average Hit Rate#
[QC on EPN]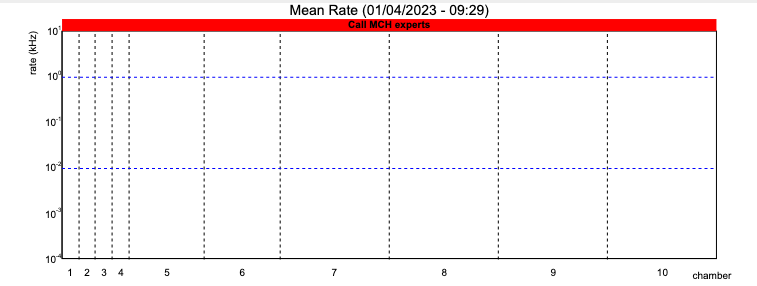
The plot shows the average hit rate (in kHz) for each detection element. A given DE is coinsidered bad if the corresponding rate is below the horizontal dashed line.
Known issues#
-
In SYNTHETIC runs, MCH global quality may depend on the replay configuration
- in p-p replay (500 kHz) : MCH run global quality is expected to be good. If quality is bad or medium, notify the on-call via a logbook entry
- in PbPb replay : MCH run global quality is expected to be good. If quality is bad or medium, notify the on-call via a logbook entry
- in OO replay (oo-35khz-synt-8tf) : MCH run global quality is expected to be bad (Precluster and tracks quality : bad). No need to notify the on-call via a logbook entry.
- other replay settings : MCH run global quality may oscillates between good and bad. If quality is bad or medium, notify the on-call via a logbook entry
-
In TECHNICAL runs, MCH global quality depends on the DCS state of MCH
- if MCH state is READY : MCH global quality should be good. If MCH global quality is bad a notification via a logbook entry is enough.
- if MCH state is BEAM_TUNING (BEAM_TU) or STANDBY_CONFIGURED (STDB_CO): MCH global quality is expected to be bad. Only the "Decoding errors" is expected to have a good quality; if this is not the case a notification via a logbook entry is enough.
-
In COSMICS runs, the low number of tracks makes it difficult to compute the efficiency for all detection elements in each cycle. Hence oscillations between good and bad status should be expected.
- if Bad Preclusters quality: Bad Mean Efficiency vs DE(B) and Mean Efficiency vs DE(NB) show multiple bins below threshold value. This is a known issue, no need to notify.
- if the global quality is bad continuously for more than 1 hour, please make a notification via a logbook entry.
-
FLP Infologger
- QC plots have been disabled and will generate some errors about not-found plots that can be ignored, for instance :
- Requested resource does not exist: ali-qcdb.cern.ch:8083/qc/MCH/QO/DecodingCheck/1709911754085/PeriodName=LHC24aa/RunNumber=548050/
- Requested resource does not exist: ali-qcdb.cern.ch:8083/qc/MCH/QO/PreclustersCheck/1709911754085/PeriodName=LHC24aa/RunNumber=548050/
- Requested resource does not exist: ali-qcdb.cern.ch:8083/qc/MCH/QO/DecodingCheck/1709911754085/PeriodName=LHC24aa/RunNumber=548050/
- QC plots have been disabled and will generate some errors about not-found plots that can be ignored, for instance :