MFT#
SYNTHETIC vs. REPLAY runs#
The run type 'SYNTHETIC' is a replay of existing data (the detector FEE, CTP, and DCS are not involved, but the files are subjected to the standard processing on FLPs and EPNs). However, one needs to be careful since this run type currently encompasses two different categories:
-
A real SYNTHETIC data, which are based on MC simulations. In the case of MFT, for example, this data do not contain any chips in Error, Fault or Warning.
-
REPLAY data, which are based on real data, which were collected in the past.
Whether a SYNTHETIC run corresponds to the category 1 or 2 can be inferred from the Bookkeeping field 'Readout Config URI'. Examples:
file:///local/replay/2024-04-17-pbpb-50khz-synt-4tf/readout-replay-24g.cfgis a MC simulation (true synthetic),file:///local/replay/2024-04-24-pp-500khz-replay-LHC24ae_550337/readout-replay-24g-dd352.cfgis a replay of 550337 (pp),file:///local/replay/2024-02-07-pbpb-50khz-replay-LHC23zzk-544490/readout-replay-24g.cfgis a replay of 544490 (PbPb).
Description of the plots in the MFT QC layout for SYNTHETIC runs#
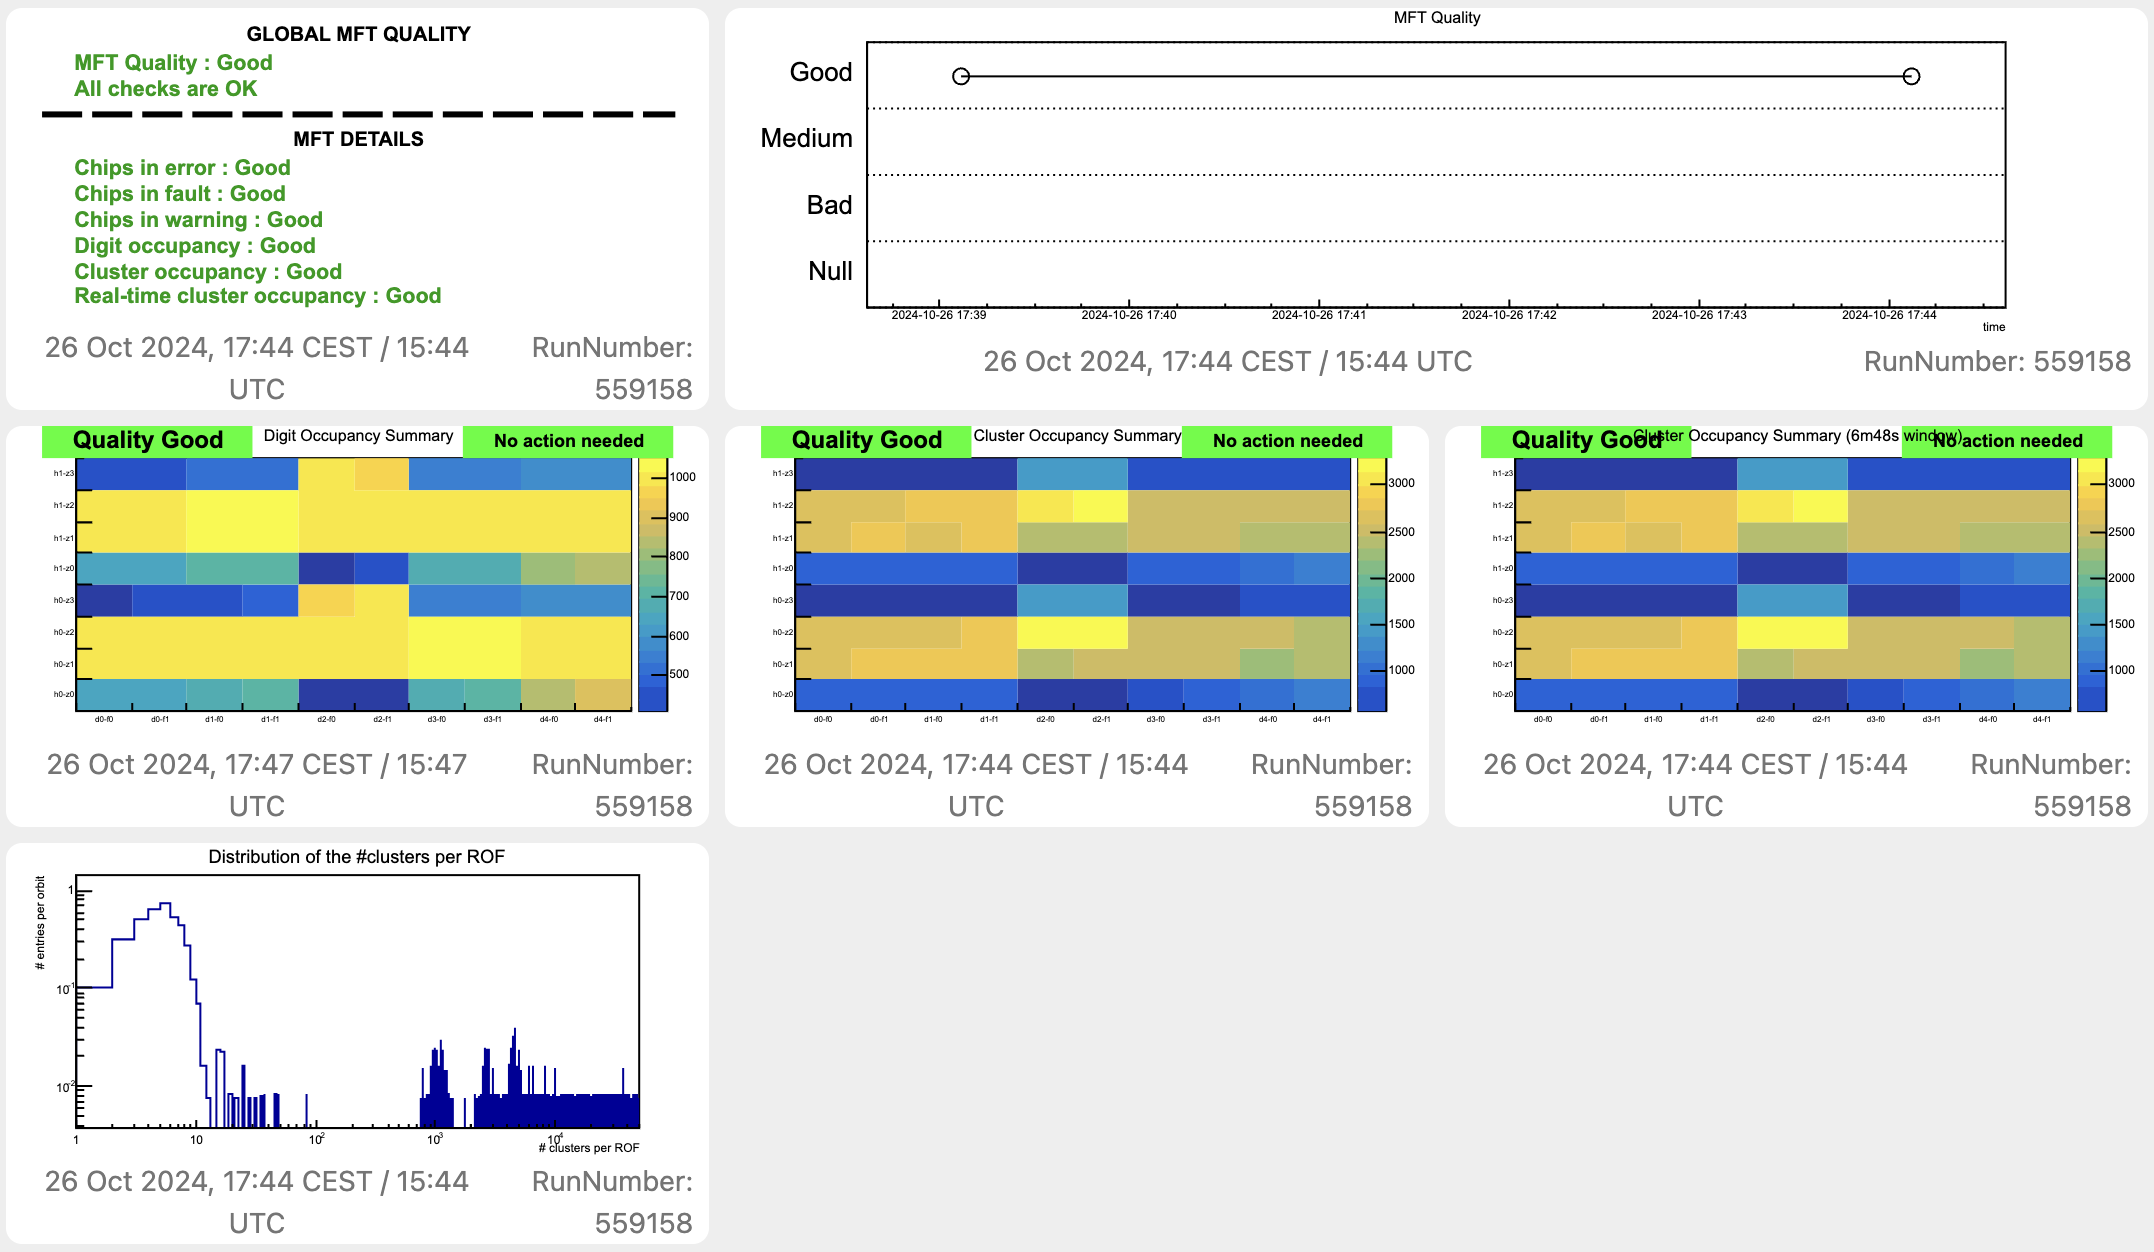
Quality summary#
The left panel summarizes all MFT QC checks for the last QC cycle. The top row provides a summary of the quality status with a text message suggesting actions to be taken. The right panel provides a time trend of the MFT quality summary.
Digit Occupancy Summary#
This plot is created on the FLPs and shows the number of digits per MFT zone per LHC orbit. It contains all data since SOR. There is an automatic checker for empty ladders (each MFT zone is composed of multiple ladders):
- If some individual ladders are empty, the quality turns Medium
- If at least two adjacent ladders are empty, the quality turns Bad.
Cluster Occupancy Summary#
This plot is created on the EPNs and shows the number of clusters per MFT zone per LHC orbit. It contains all data since SOR. There is an automatic checker for empty ladders (each MFT zone is composed of multiple ladders):
- If some individual ladders are empty, the quality turns Medium
- If at least two adjacent ladders are empty, the quality turns Bad.
The second Cluster Occupancy Summary, on the right, is the same plot, but only contains data from the last "moving window" (duration approximately 2 mins). There is also an automatic checker for empty ladders with the same settings, the output of this checker corresponds to the "Real-time cluster occupancy" shown in the "Quality Summary" at the top.
Distribution of clusters per ROF#
This plot is created on the EPNs and shows the number of clusters per MFT ROF (readout frame). The data are normalized by the number of LHC orbits.
Checks to be done#
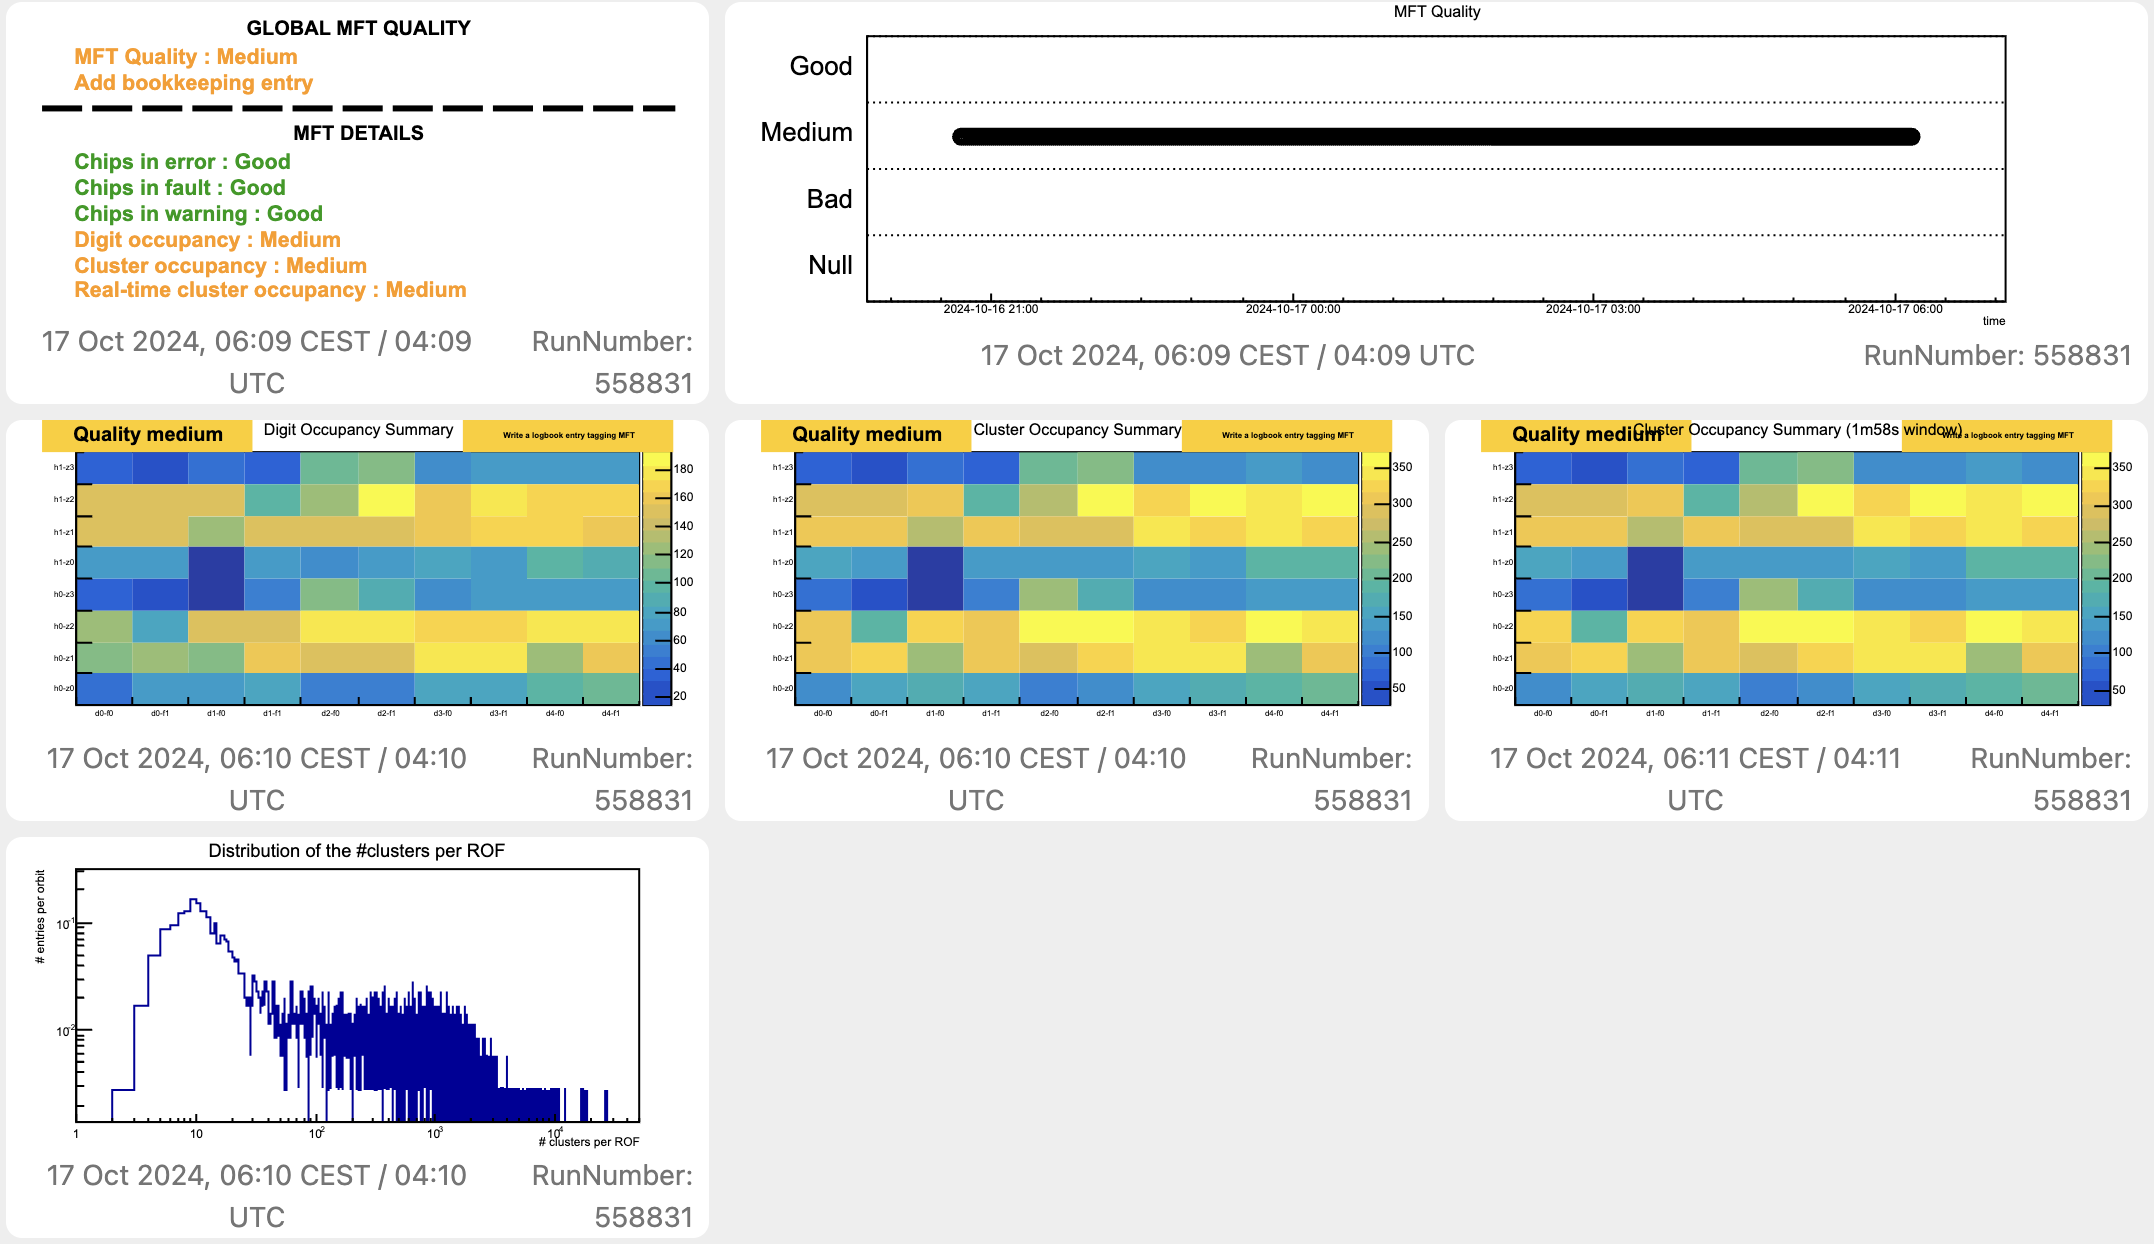
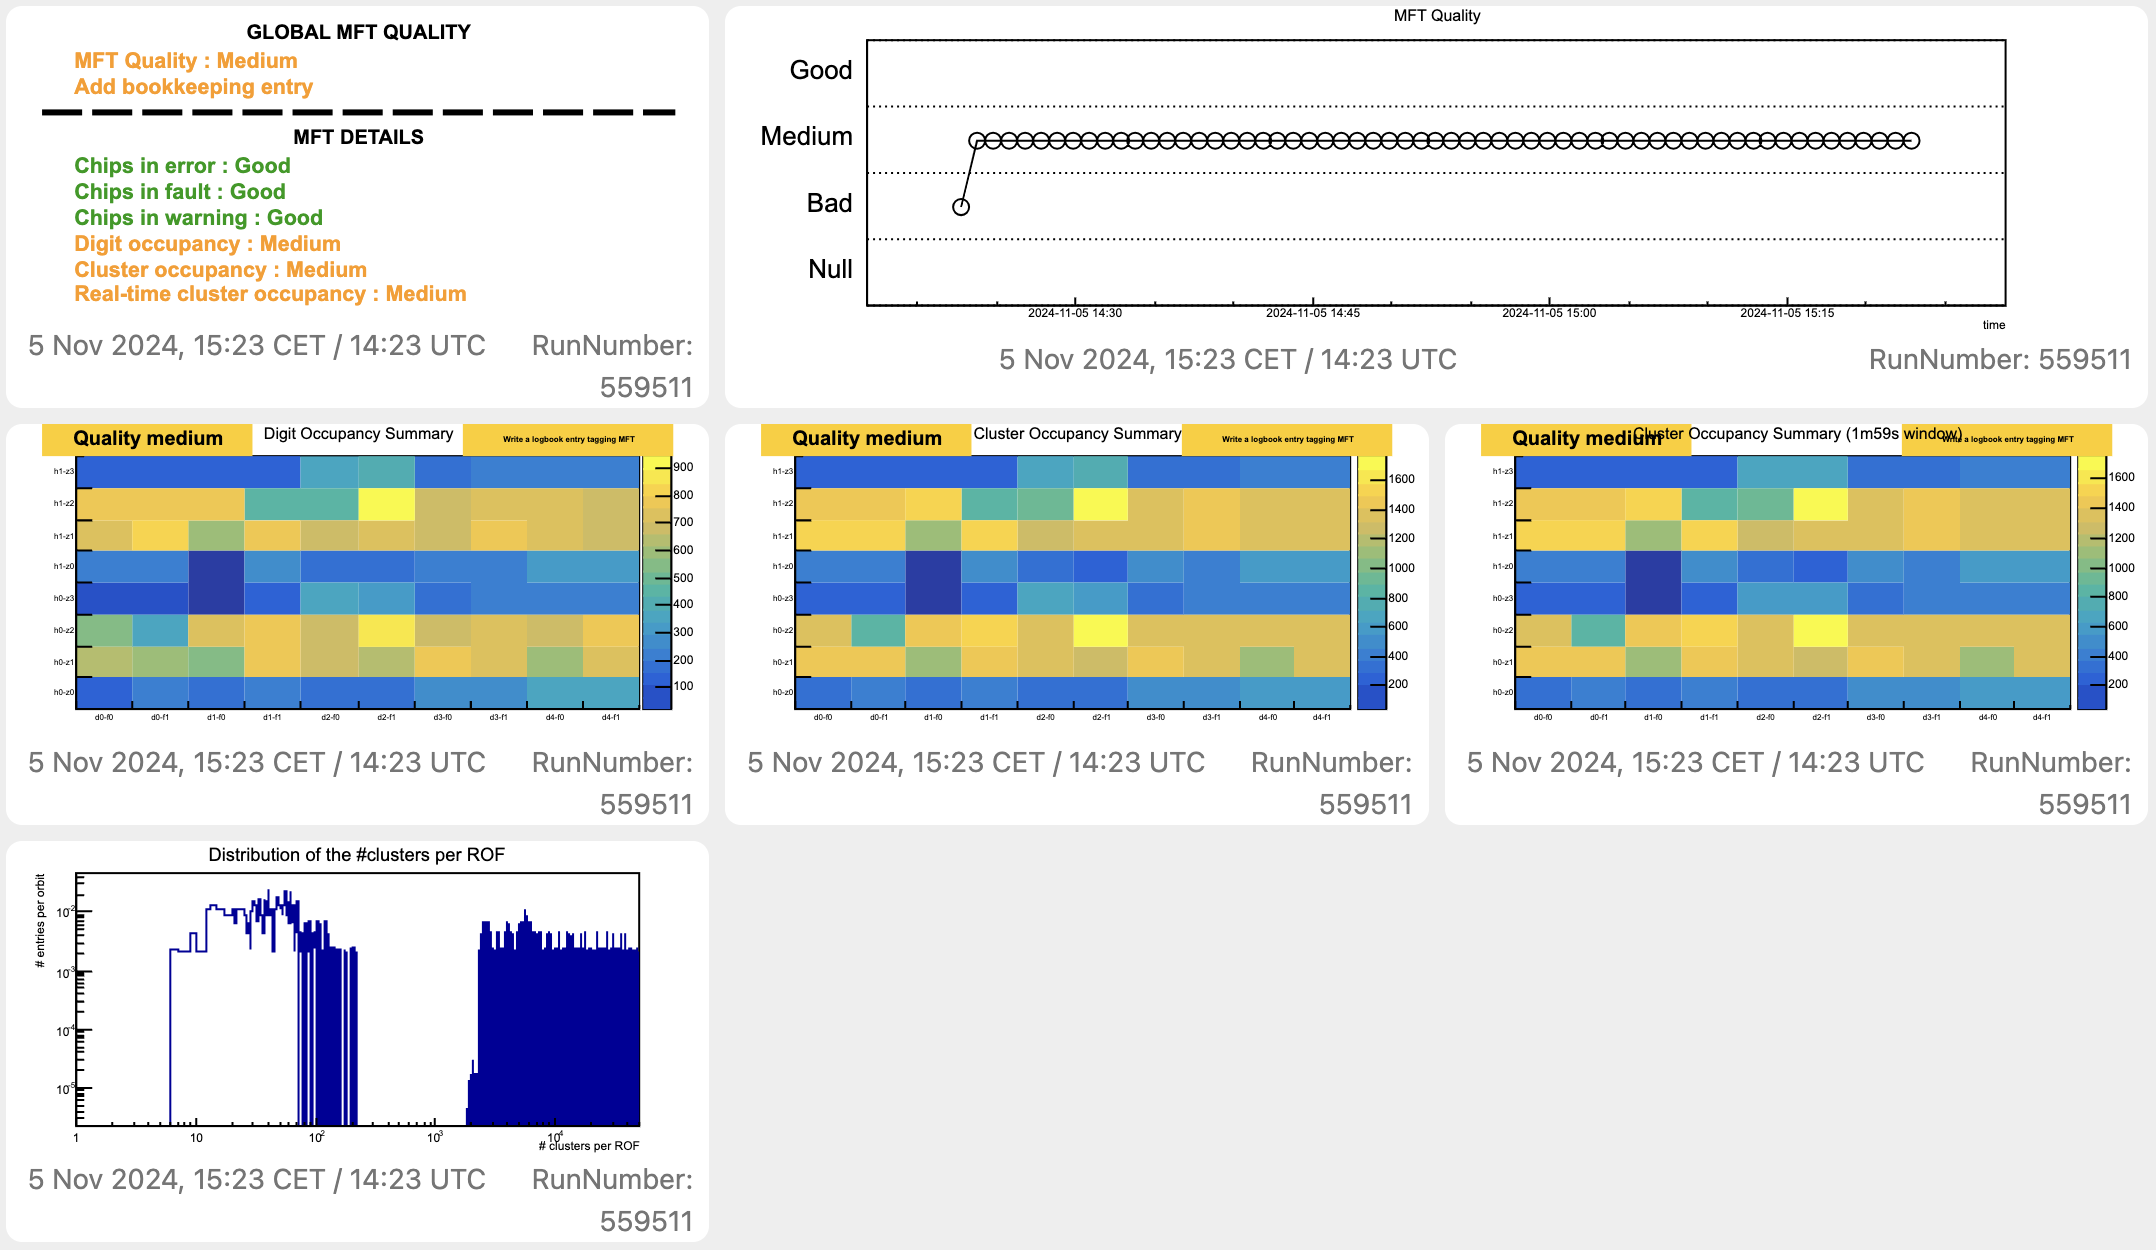
Check what type of data is being replayed and compare them without the expected output shown below. Note that the current pp and PbPb replay files (based on 550337 and 544490, respectively) always result in Medium quality due to improvements to the MFT QC software, which now imposes stricter limitations than than when these runs were selected as replay candidates. Create a log entry only if the QC objects for the current run are not consistent with the expected outputs listed below.
Expected output for true SYNTHETIC#
Readout Config URI: file:///local/replay/2024-04-17-pbpb-50khz-synt-4tf/readout-replay-24g.cfg
Expected output for REPLAY pp#
Readout Config URI: file:///local/replay/2024-04-24-pp-500khz-replay-LHC24ae_550337/readout-replay-24g-dd352.cfg
Expected output for REPLAY PbPb#
Readout Config URI: file:///local/replay/2024-02-07-pbpb-50khz-replay-LHC23zzk-544490/readout-replay-24g.cfg
Known issues#
None