ITS#
General considerations#
If any of the plots listed in this page remains empty during a run, please call the ITS on-call.
Fake-hit rate overview#
[QC on FLP - plot integrated over the run]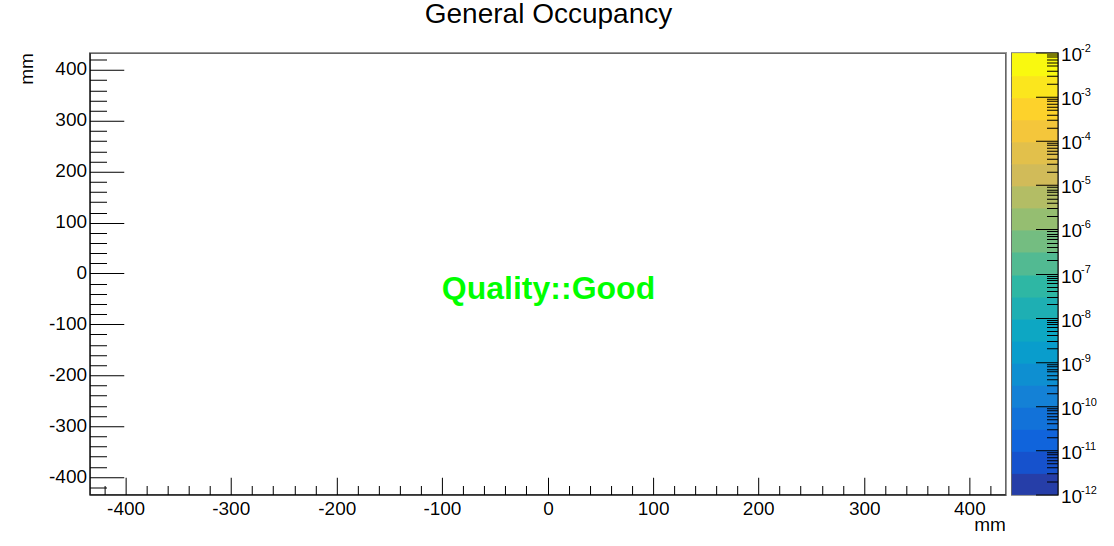 Overview of the fake-hit rate for all ITS staves. In the case of entries, the fake-hit rate is displayed with the colored scale in hits/event/pixel for every stave. For the technical run, this plot is expected to stay empty. Please call the ITS on-call if you see any entries.
Trigger count vs TriggerID and FeeID#
[QC on FLP - plot integrated over the run]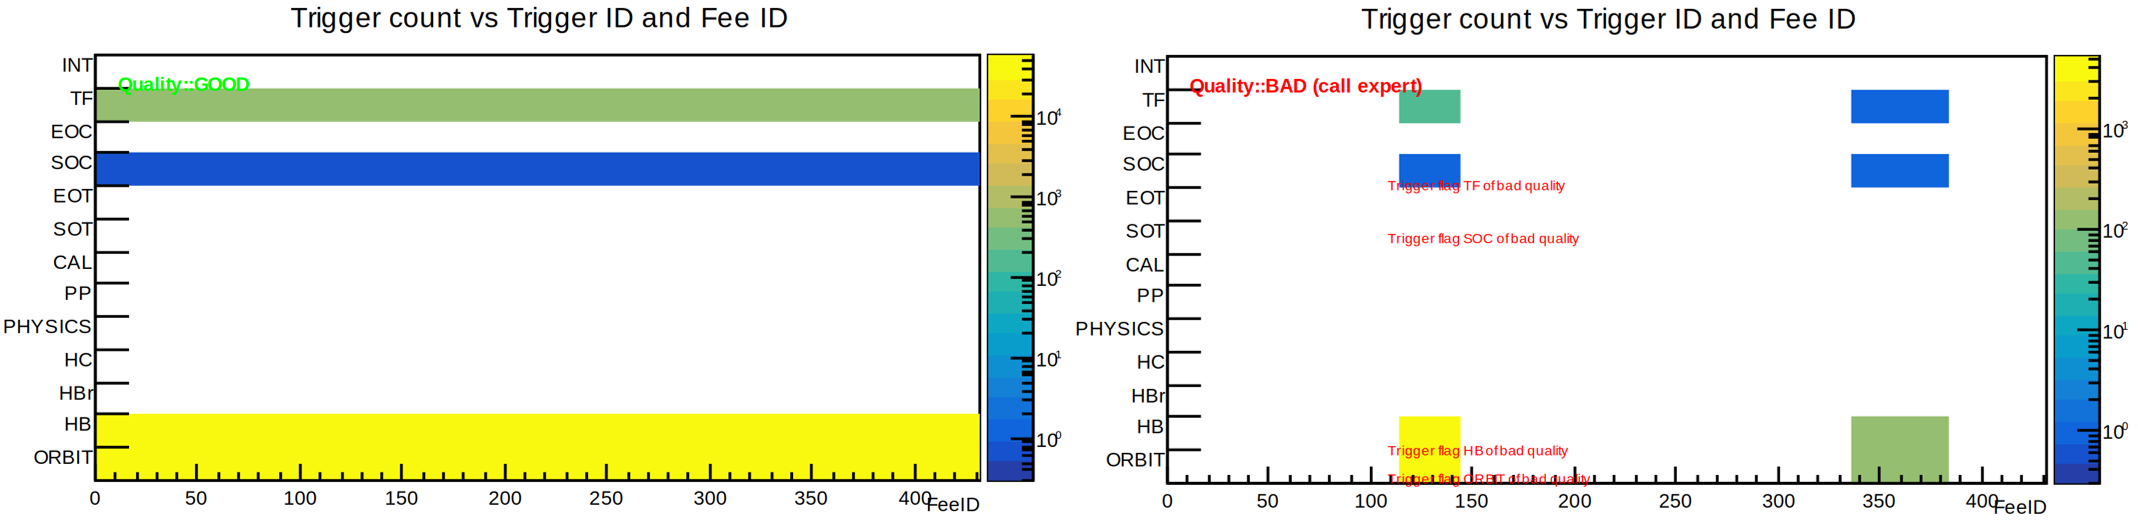 Plot summarizing trigger flags. The colored scale represents the counts in each bin. The normal plot is shown on the left panel, while the problematic one is depicted on the right. QC can plot the following error messages:
- Quality::GOOD
- Quality:: BAD: Trigger flag (TRIGGER_NAME) of bad quality
Call the ITS on-call in the case of BAD quality messages and also in the following cases:
- there are x-bins without entries (i.e., vertical white lines on the plot)
- entries are present in the empty lines in the example plot above.
- the plot is completely empty
Payload size vs FeeID#
[QC on FLP - plot integrated over the run]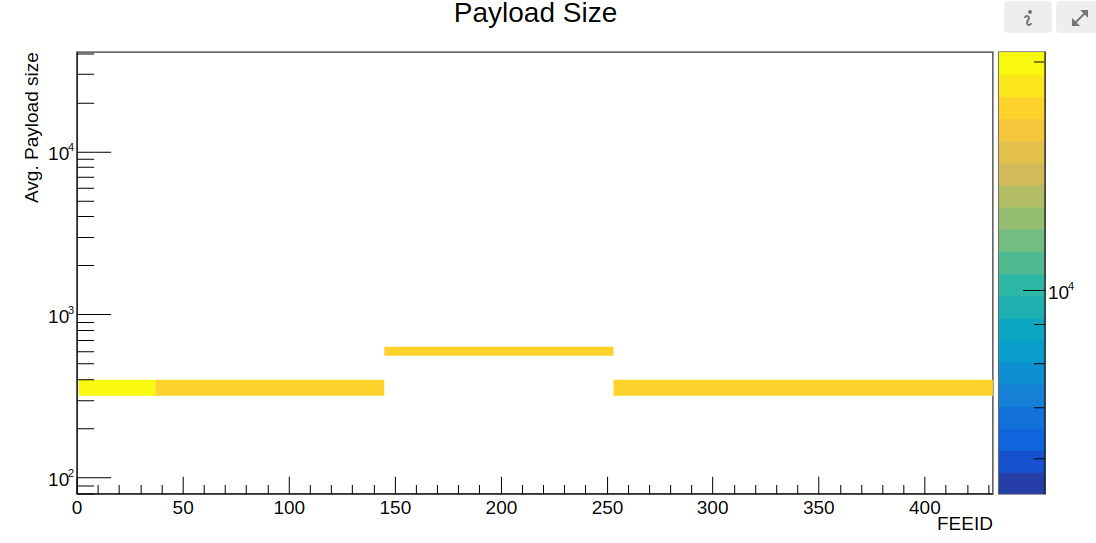
Plot showing the payload size of every link (FeeID). Values on the y-axis must be like in the plot or all identical to each other. QC will provide the following data quality messages for this plot:
- Quality::GOOD
- Quality:: BAD: Payload size too large for technical runs
- Quality:: BAD: Payload size is missing for some FeeIDs
Call the ITS on-call in case of BAD quality messages or plot will differ from the provided example.