ZDC#
Instructions for shifter in Pb-Pb
Please remember to always double check the current run number. The plots will update every minute.
Baseline [QC on FLP]#
| Green: good quality | Orange: Warning quality | Red: bad quality |
|---|---|---|
 |
 |
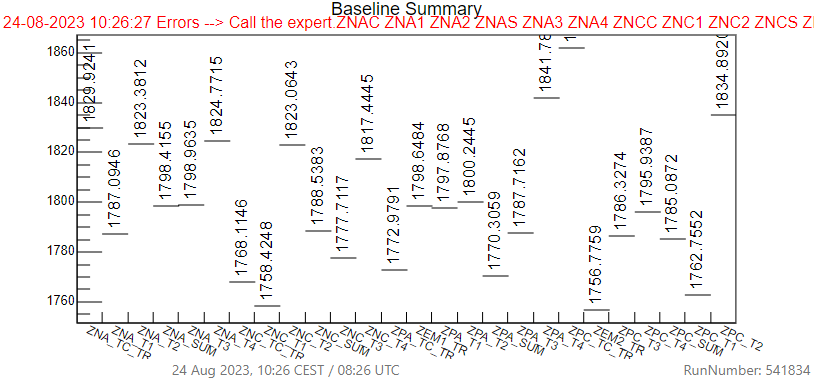 |
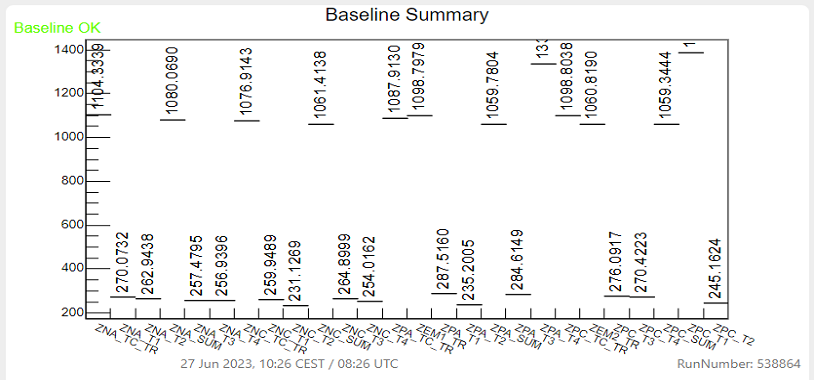
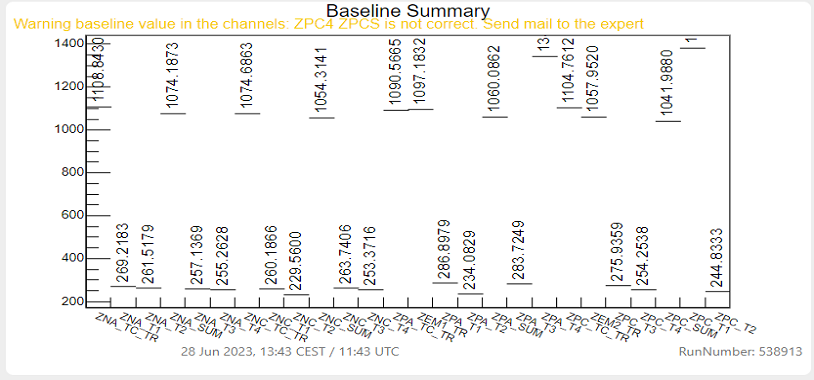
The plot shows the baseline mean values of each ZDC channel. The quality of the histogram is determined by verifying the deviation from the expected average value.
- If the plot is empty or the text is red --> call the on-call.
- if the plot text is orange --> insert a log entry
Align Plot [QC on FLP]#
| Green: good quality | Red: bad quality |
|---|---|
 |
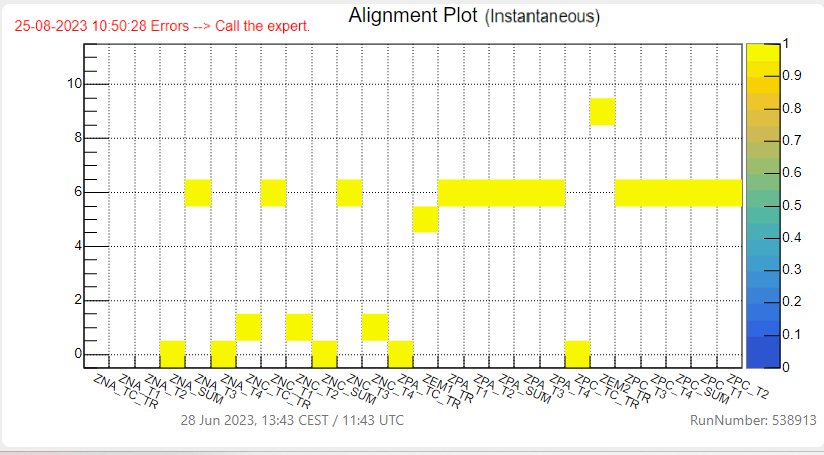 |
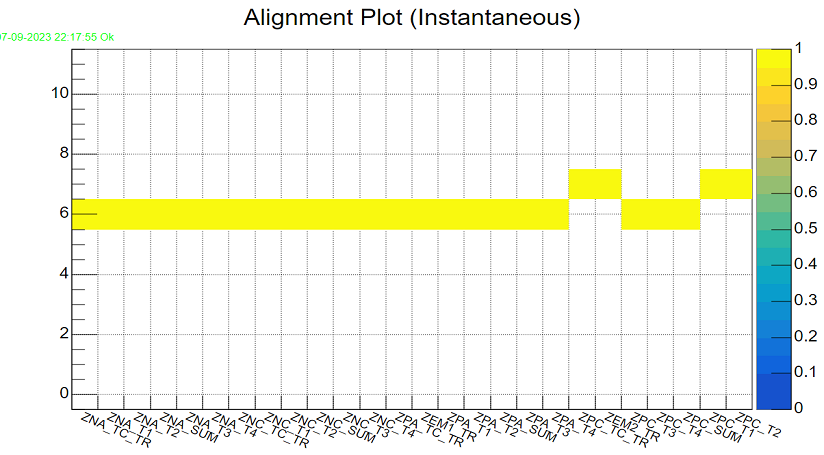
The plot shows if all channels are aligned. Most of the channels should be centered on sample 6. If any channel deviates by plus or minus one, it is considered good. - If the plot shows any errors. --> Call ZDC on-call - if the plot contains empty channels --> Call ZDC on-call
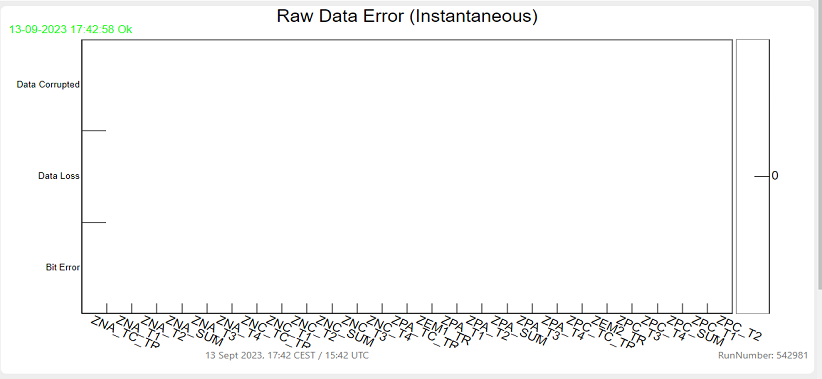
Raw Data Error [QC on FLP]#
| Green: good quality | Red: bad quality |
|---|---|
 |
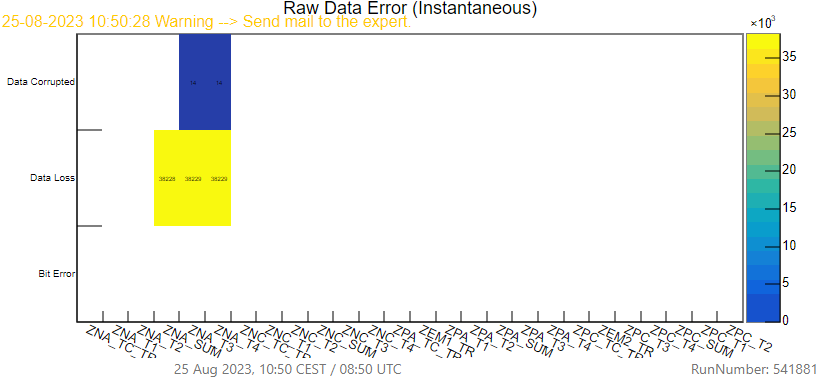 |
The Raw Data Error plot must be empty. The plot indicates the presence of the following errors: data corrupted, data loss, generic error. The plot resets every five minutes, so if it was a temporary error then it will disappear. - If the plot shows any errors. --> Call ZDC on-call
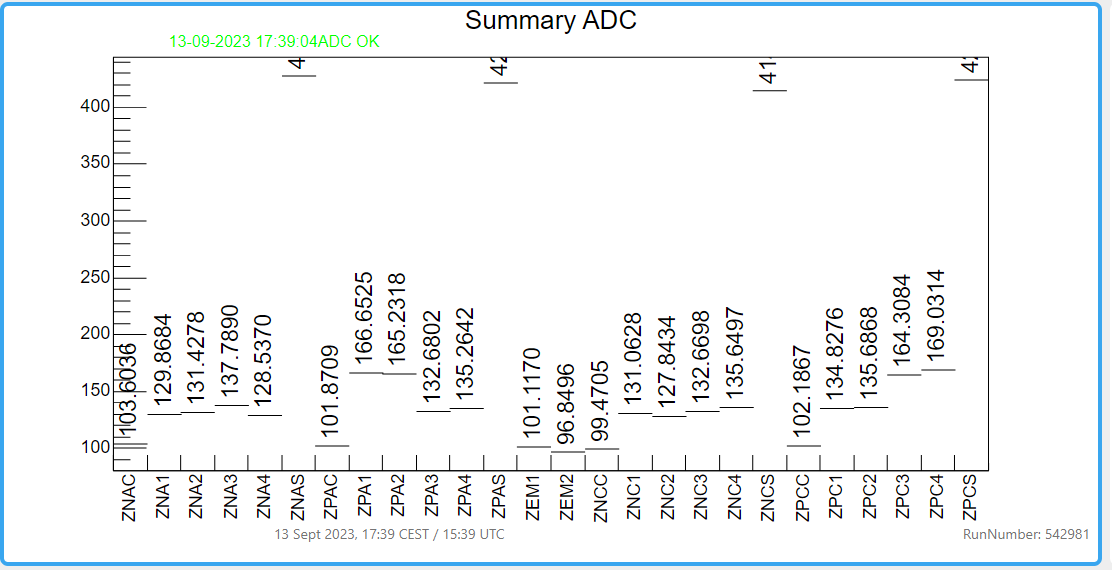
Summary ADC [QC on EPN]#
| Green: good quality | Red: bad quality |
|---|---|
 |
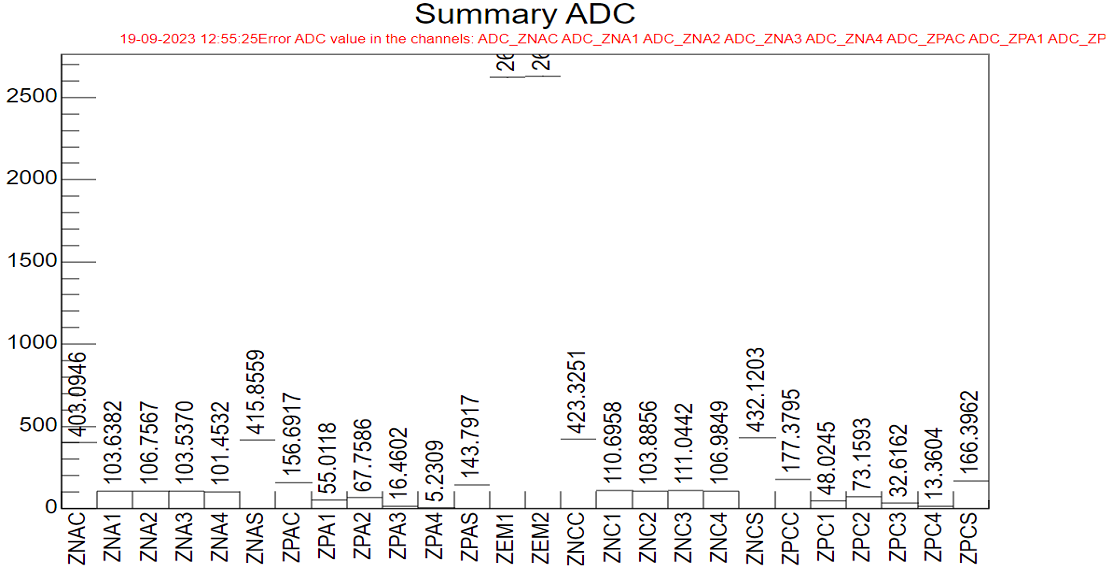 |
The plot shows the baseline mean values of each ZDC ADC channel. The quality of the histogram is determined by verifying the deviation from the expected average value. - If the plot is empty or the text is red --> call the on-call. - if the plot text is orange --> insert a log entry
Summary TDC [QC on EPN]#
| Green: good quality | Red: bad quality |
|---|---|
 |
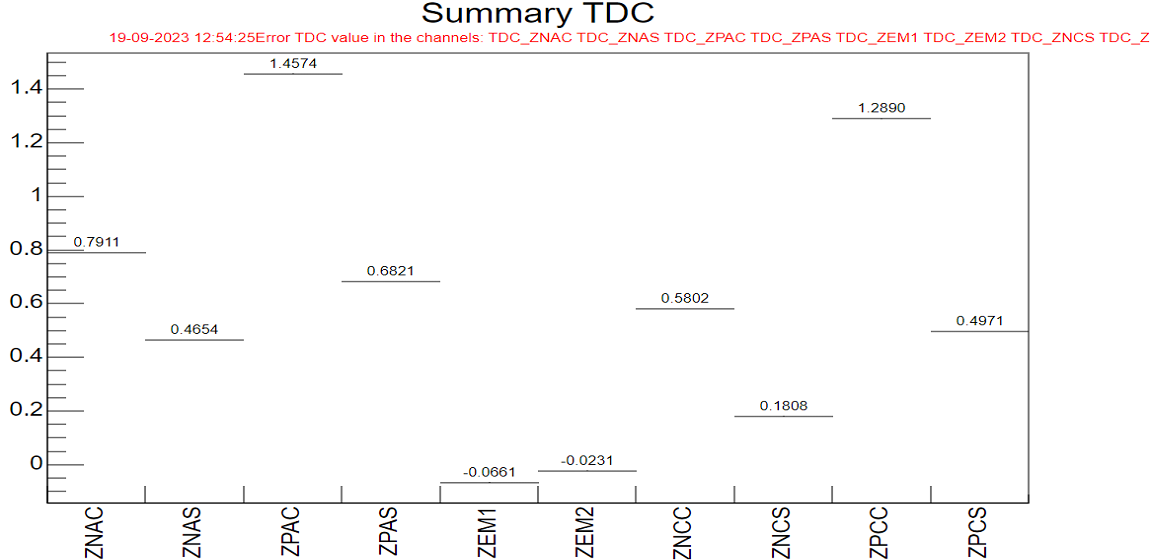 |
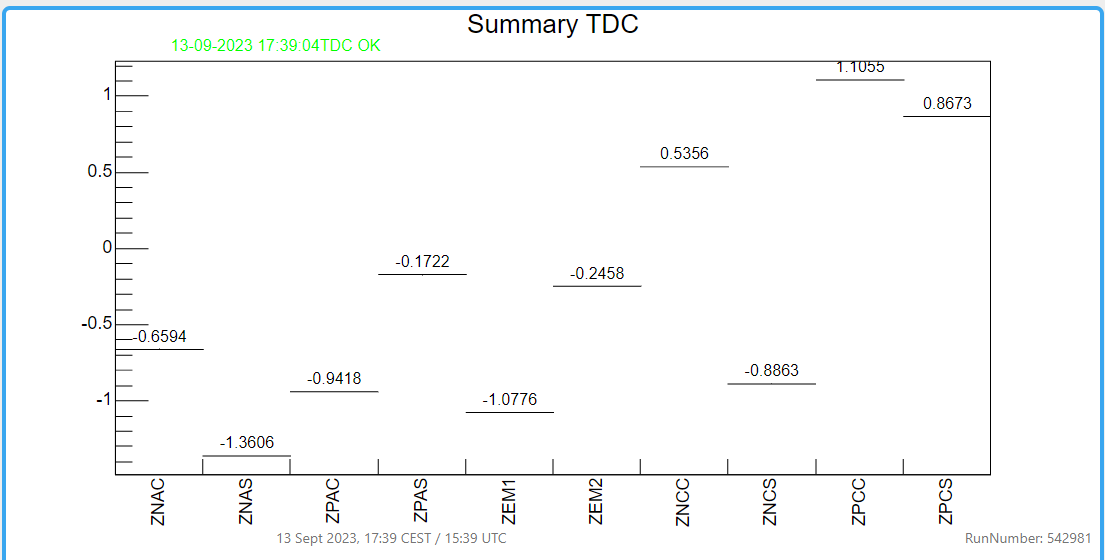
The plot shows the baseline mean values of each ZDC TDC channel. The quality of the histogram is determined by verifying the deviation from the expected average value.
Known issues#
FLP InfoLoger: message: "Baseline Error in PED_Z%" message: "Rec Error in ADC_Z%" Detector ZDC. During SYNTHETIC runs this can be ignored.