TRD#
Layout for physics runs in Pb-Pb#
Note:
- all QC tasks for TRD are running on the EPNs
- the layouts for TRD are currently undergoing major changes
- automatic checks will be added in the future
Data size per sector#
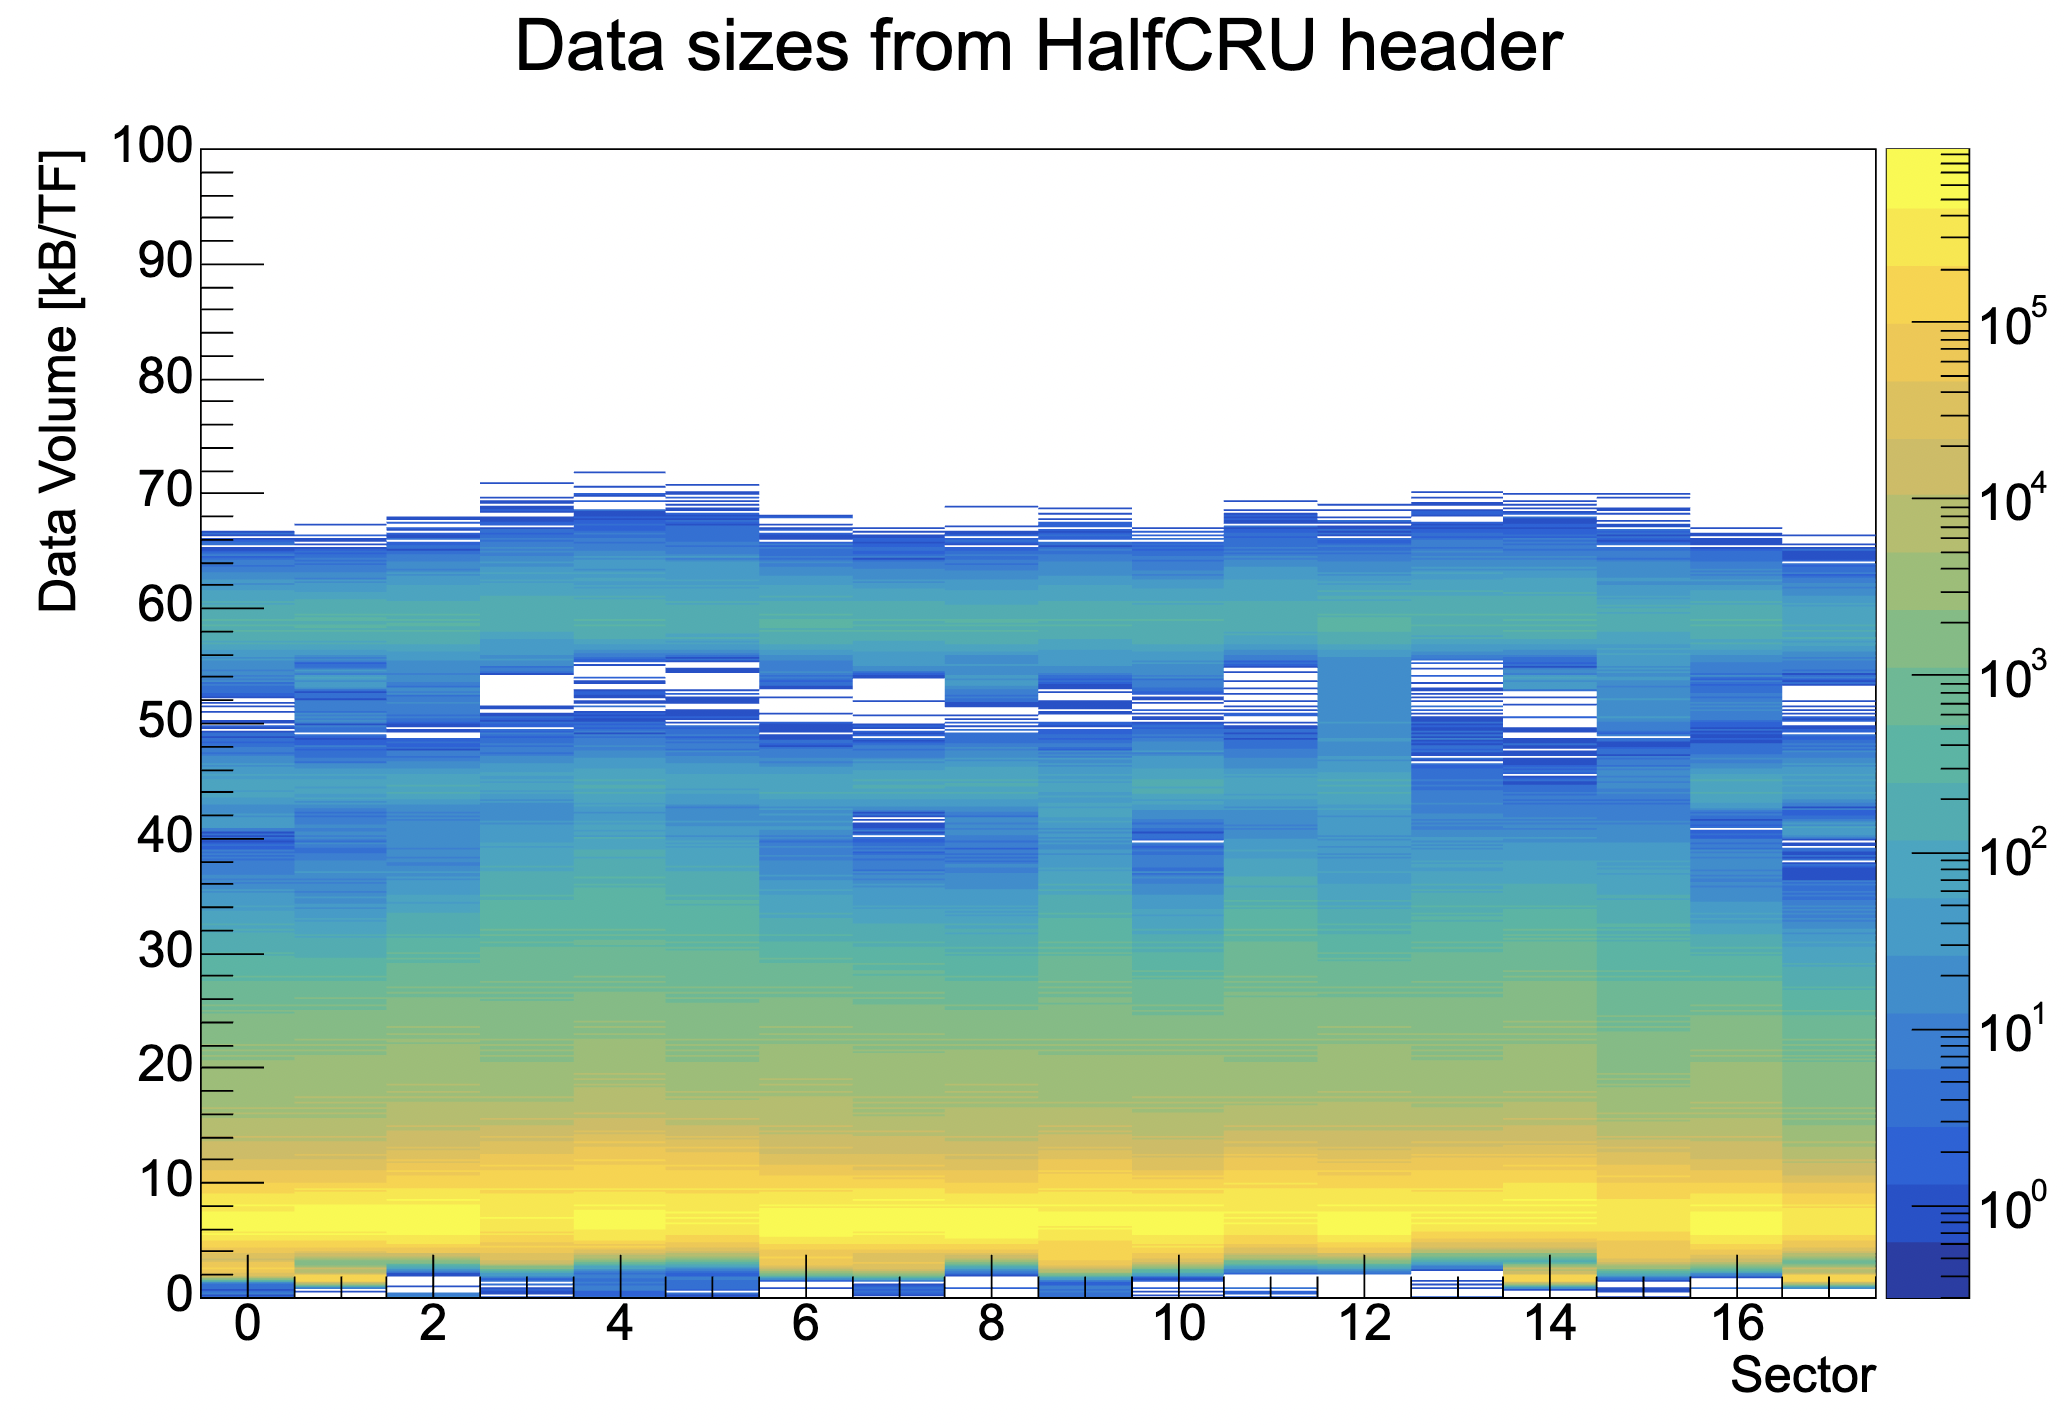
The TRD has 18 sectors which should all produce a similar data size per TF. In case on sector is deviating a lot (its mean is more/less than factor 3 from the rest) please write a bookkeeping entry tagging TRD.
Tracklet distribution in half-chambers#
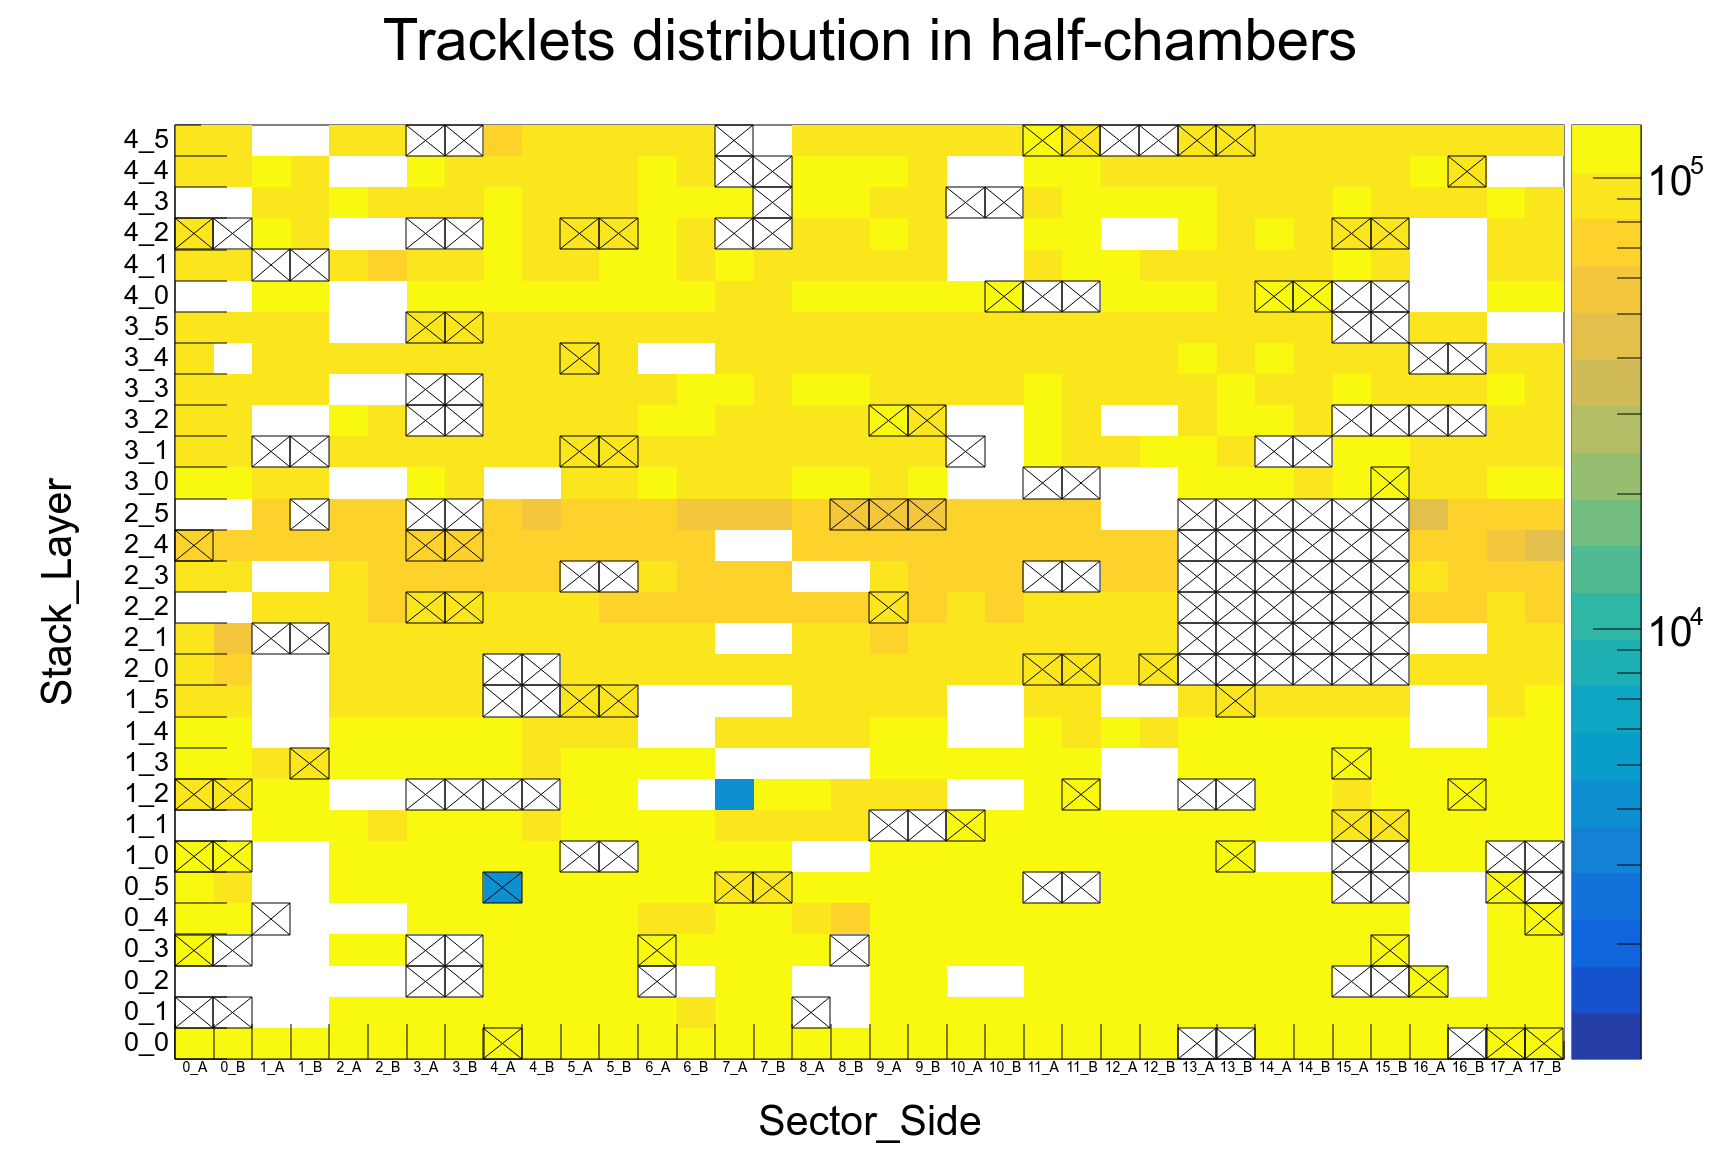
This plot shows the number of tracklets per half-chamber. The x-axis is the sector number. If you see one column completely empty please notify the TRD oncall.
The crosses on the plot are from a static half-chamber status map which needs to be replaced by a dynamic one to correctly cross out half-chambers where no data is expected because of hardware issues.
Eta-phi distribution of ITS-TPC-TRD tracks#
This plot is currently missing its title in the QCG, needs to be fixed in QC code
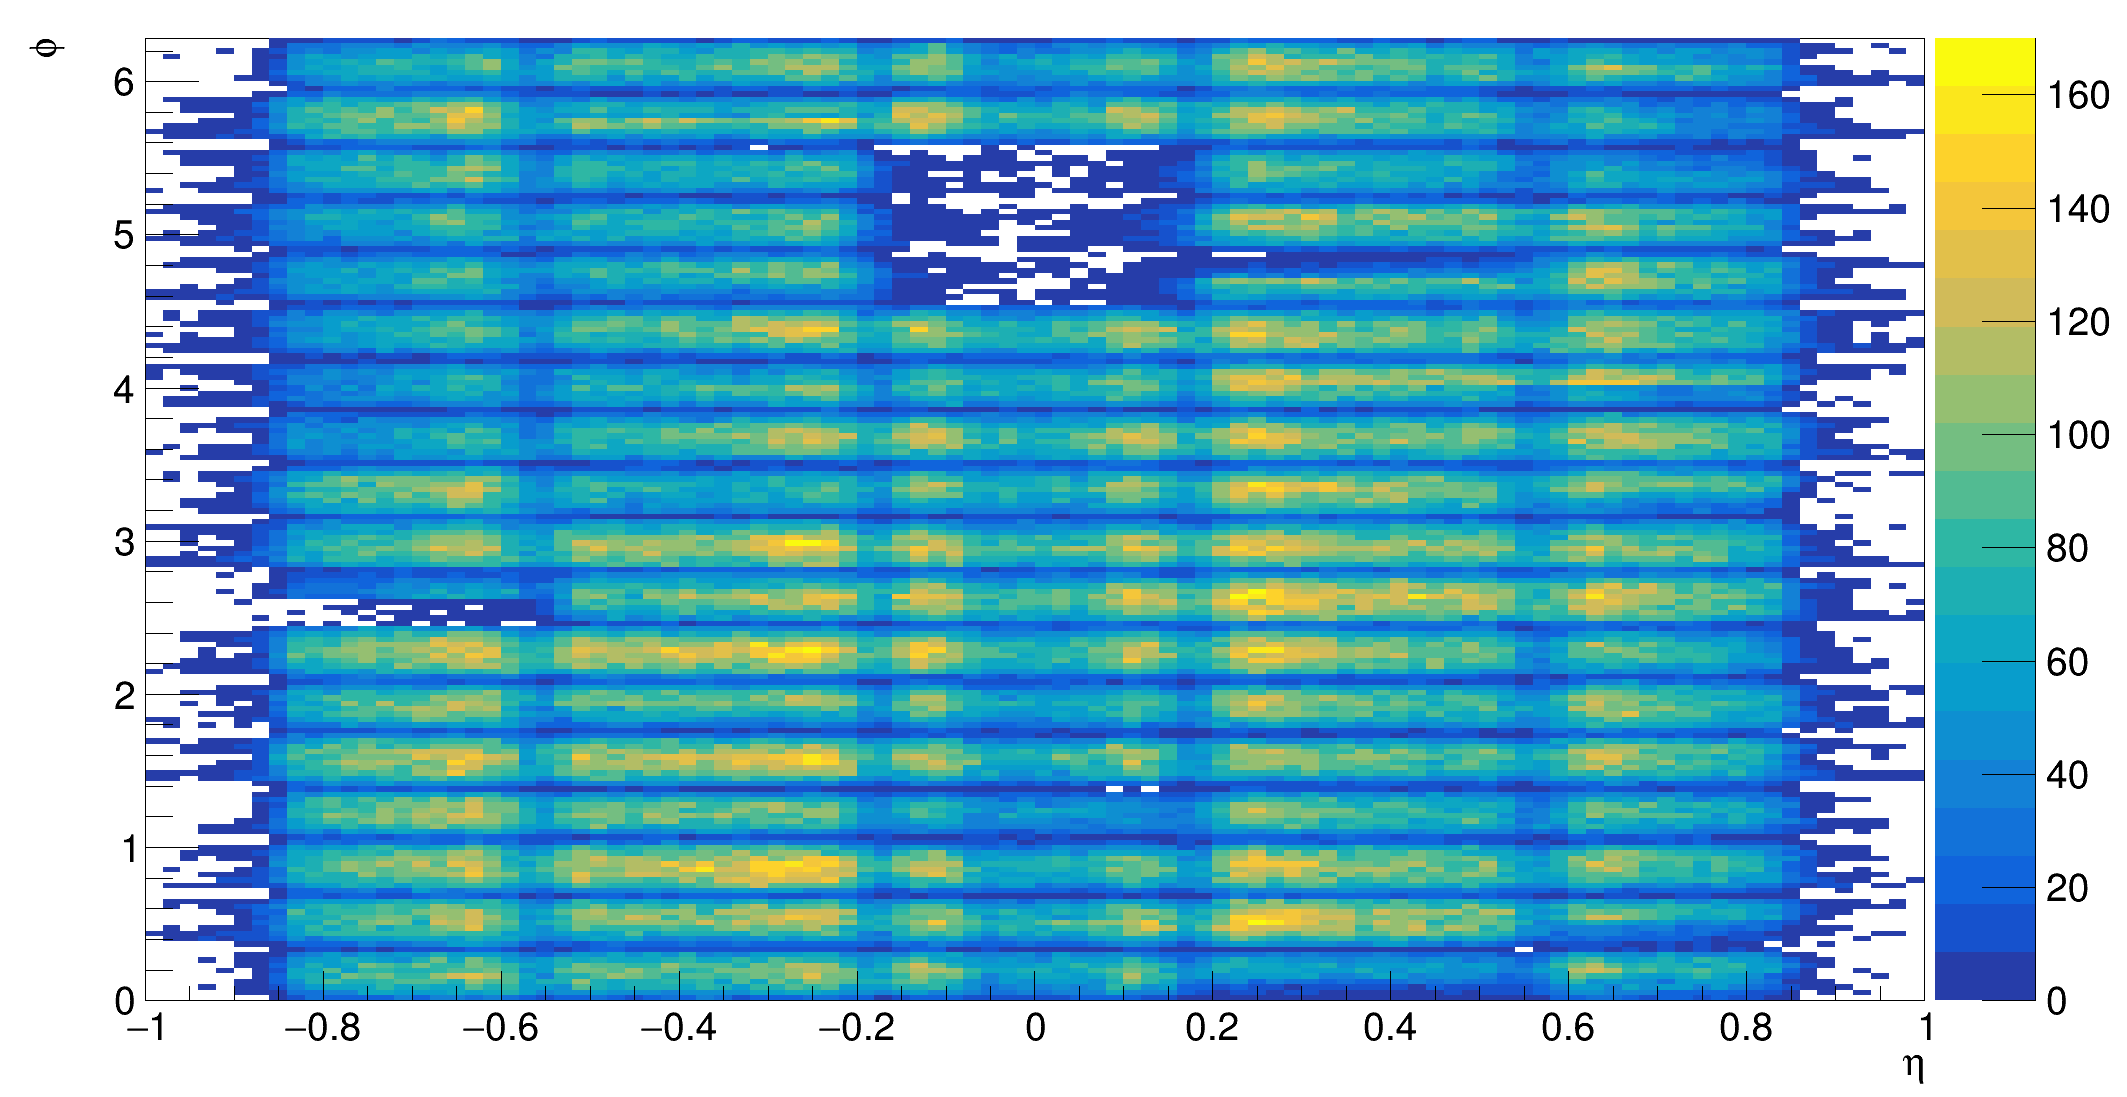
Eta-phi distribution for ITS-TPC tracks matched to at least 3 TRD tracklets. The PHOS-hole from abs(eta) < 0.2 and phi ~ 5 leads to almost no tracks in that region. No need to call TRD expert if plot does not look as example above. We are currently adding automatic checks.
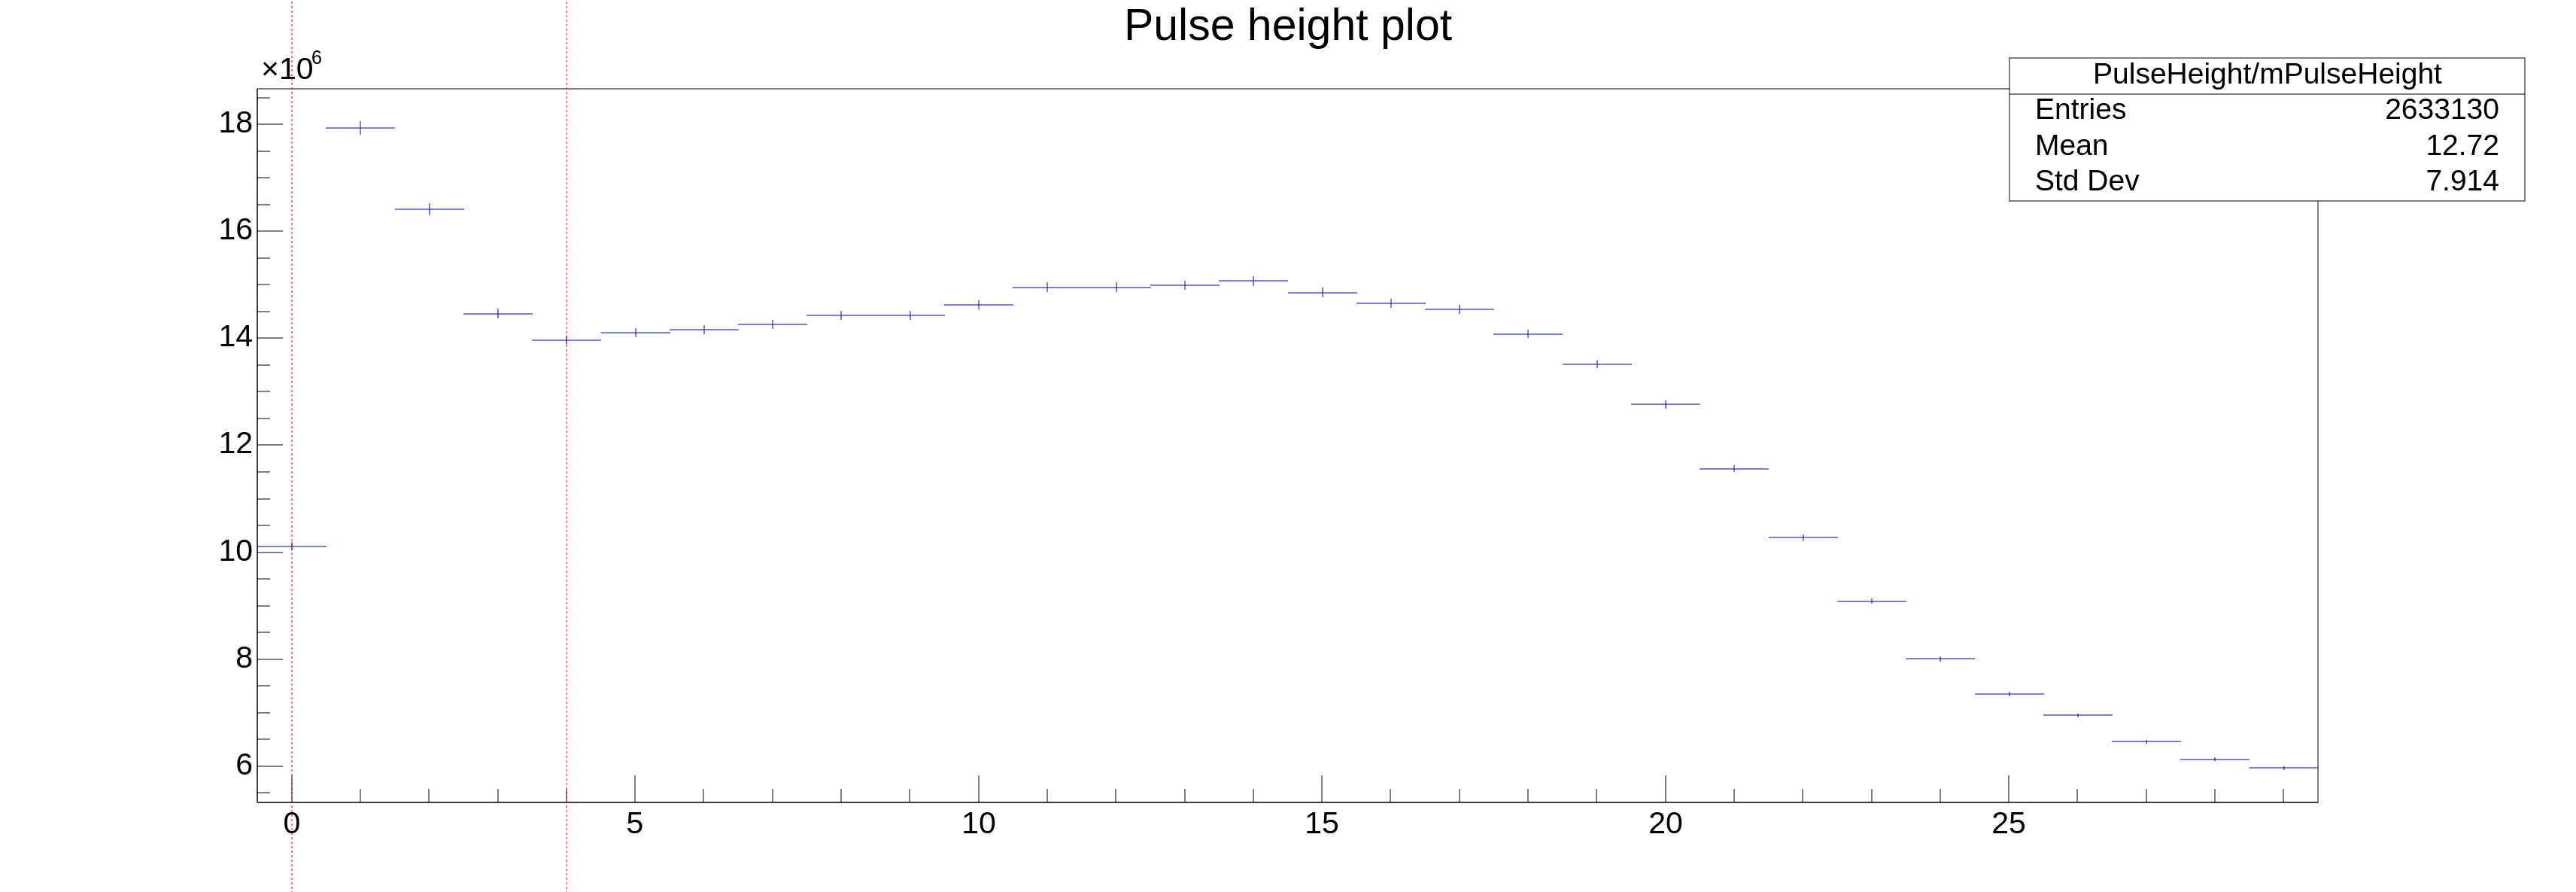
Pulse height plot based on ITS-TPC-TRD matched tracks#
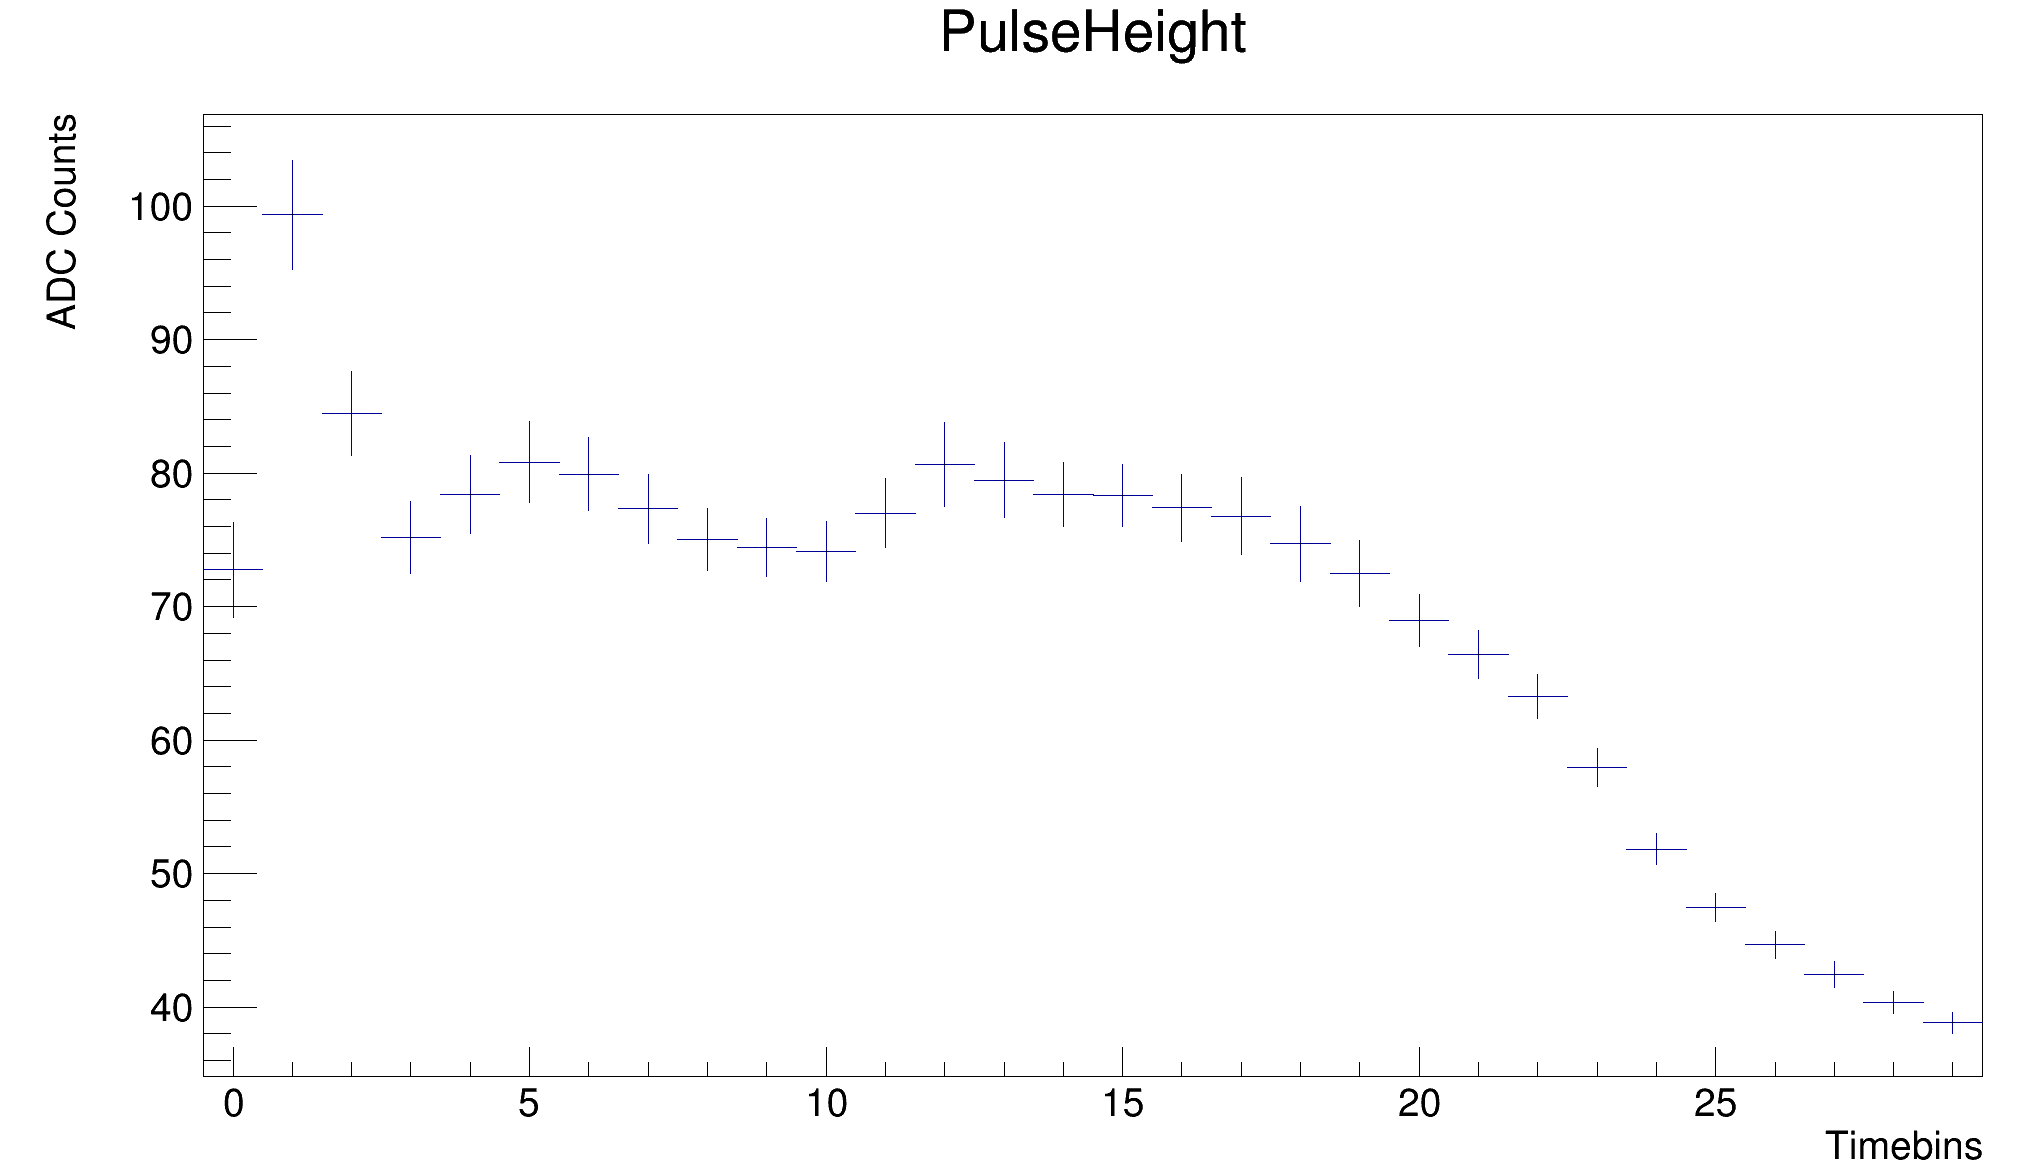
Ignore in case eta-phi distribution plot is empty or very sparsly filled.
A clear peak should be visible between time bins 0-4, followed by a plateau and a falling edge around 20. If plot does not look approximately as in the example above (and the track eta-phi plot is filled) please create a bookkeeping entry tagging TRD.
Pulse height plot based on TRD-only data#
In case the pulse height plot based on matched tracks is filled you can ignore this plot.
A peak should be visible between time bins 0-5. Call the TRD oncall if that is not the case, as there might be an issue with the trigger settings. The plateau region at larger time bins might not look as smooth as in the above picture in case there is a lot of pile-up.
Number of tracklets per event and TF#
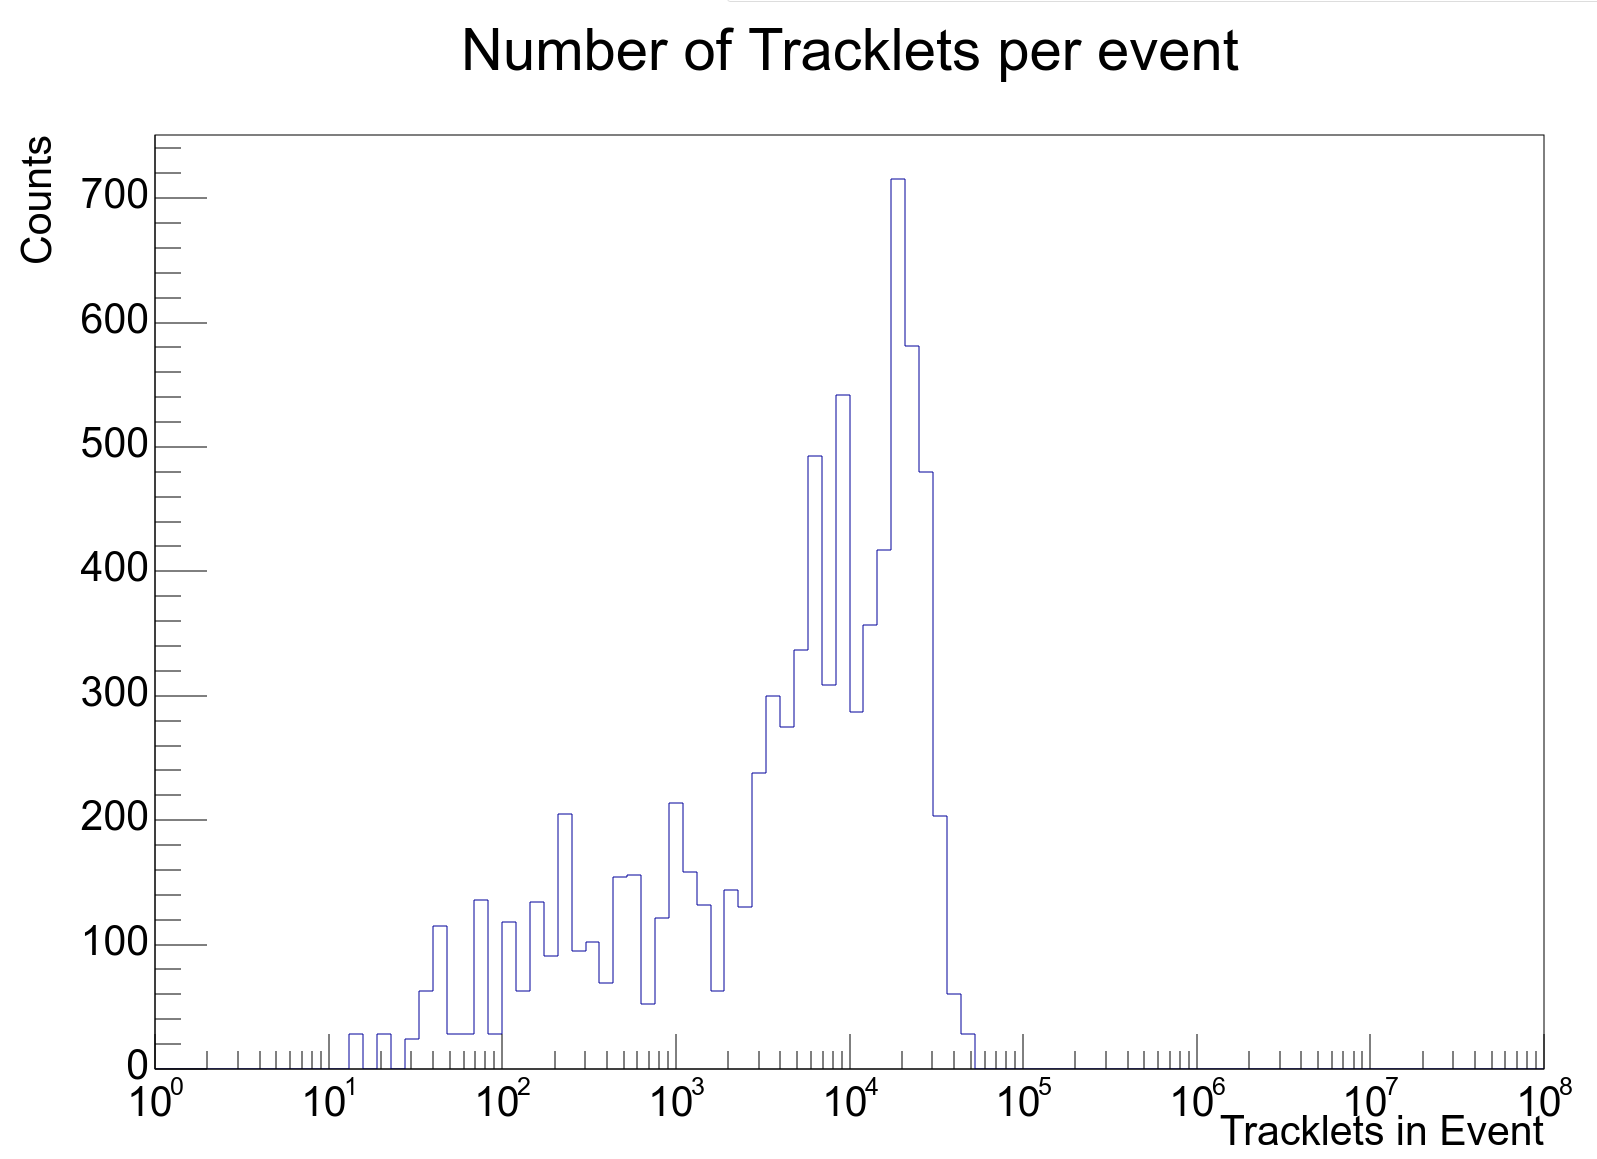
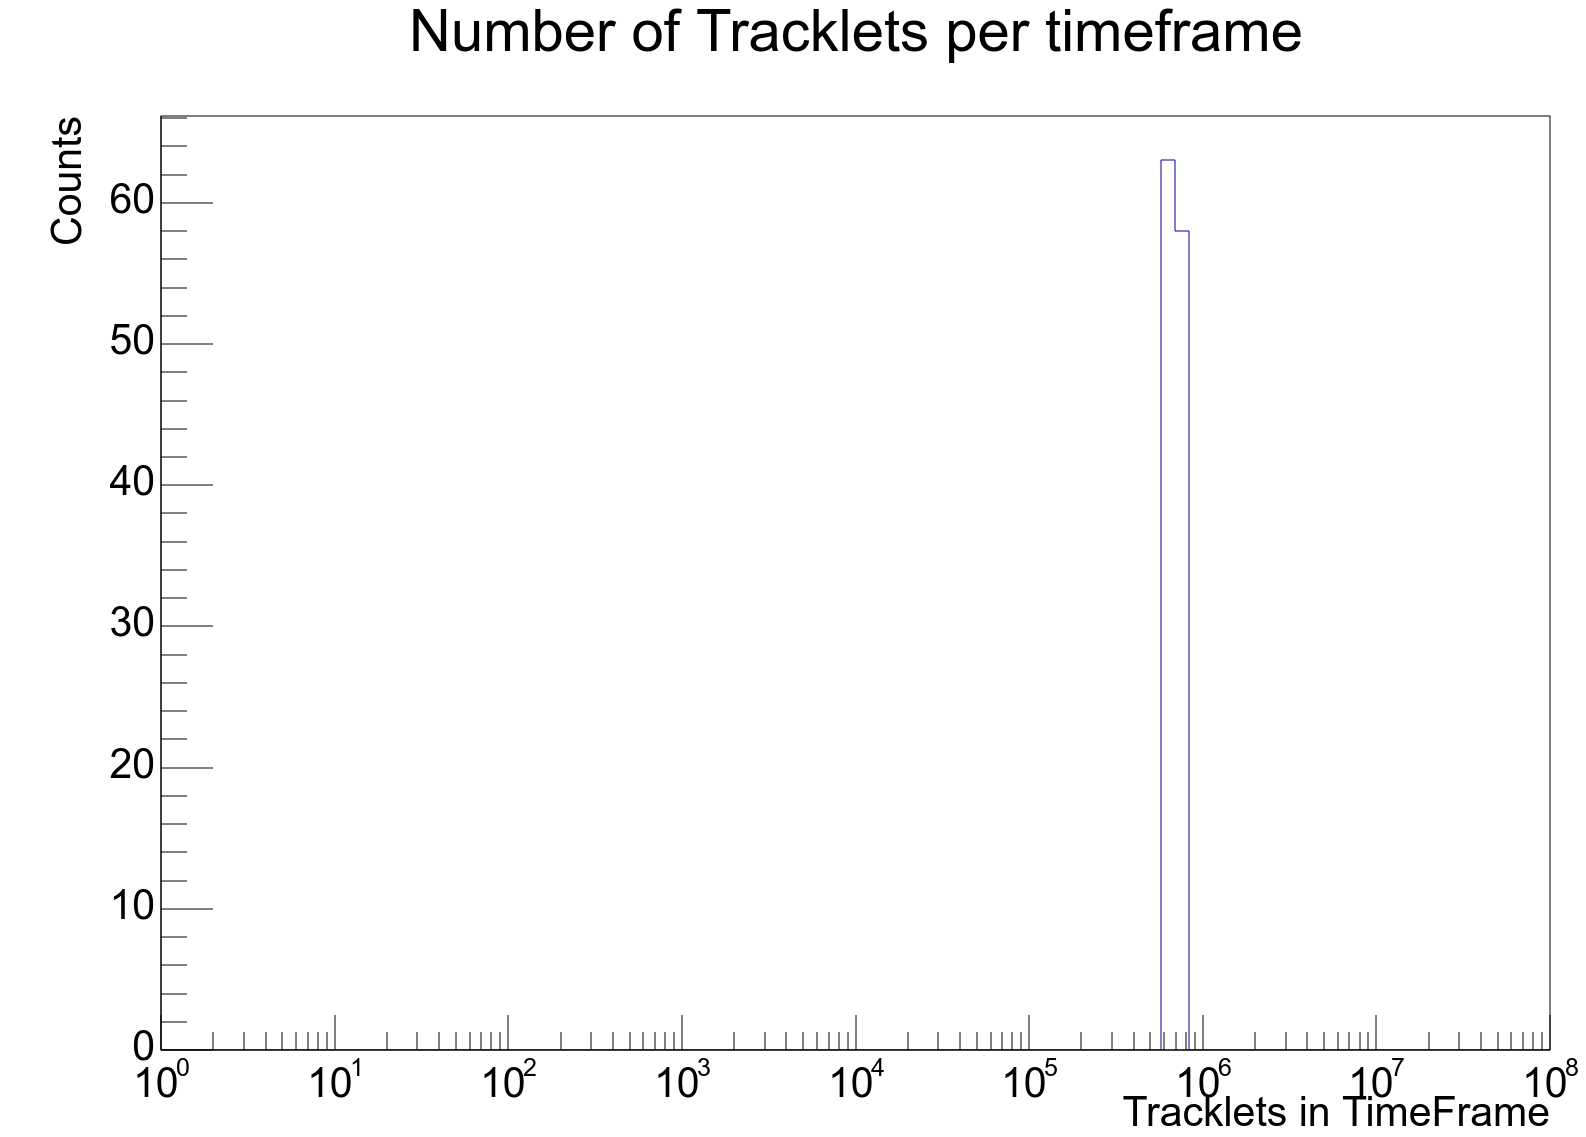
We would like to be notified via bookkeeping entry in case either more than one distinct peaks are appearing in the distributions or in case there are entries in the underflow bin in either of the two histograms.